State of the Capital Region 2023

The Ups and Downs of Mortgage Markets from the Financial Crisis through the Pandemic
![]()
We appreciate support for this report from advisory council member JBG Smith.
This report is a collaborative effort from researchers at the American Enterprise Institute, Brookings Institution, and the George Washington University. We are particularly grateful to the Trachtenberg School of Public Policy and Public Administration and the George Washington Institute for Public Policy for their support in reinvigorating the Center for Washington Area Studies over the past years. We also owe a substantial debt to Jaclene Begley for her careful editing and her incisive substantive suggestions.
Introduction
Homeownership is the primary means of wealth-building for middle-class Americans. Stable, well-regulated mortgage markets are an essential component of supporting homeownership. Most U.S. homeowners borrow at least 80% of funds needed to purchase a home, and pay down the mortgage balance gradually over 30 years. At any given time, the demand for mortgages reflects both the demand for homes—driven by household growth, demographics, income– and financial conditions, such as interest rates and the difficulty of qualifying for a loan. The past 15 years from the Great Recession through the COVID-19 pandemic have seen considerable turmoil in both housing markets and mortgage markets. As the Capital Region resets its priorities—and work arrangements—in the wake of the COVID-19 crisis, examining long-term trends in mortgage markets offers insights into household preferences.
In this report, we consider how the mortgage market has evolved over time and across the Capital Region. We focus throughout on home purchase mortgages, which reflect overall housing market factors, rather than refinances, which are more sensitive to interest rate trends. Figure I.1A and Figure I.1B below show our definition of the 24 jurisdictions in the Capital Region. We divide the region into urban, suburban and exurban areas.
Figure I.1A: Jurisdictions of the Capital Region
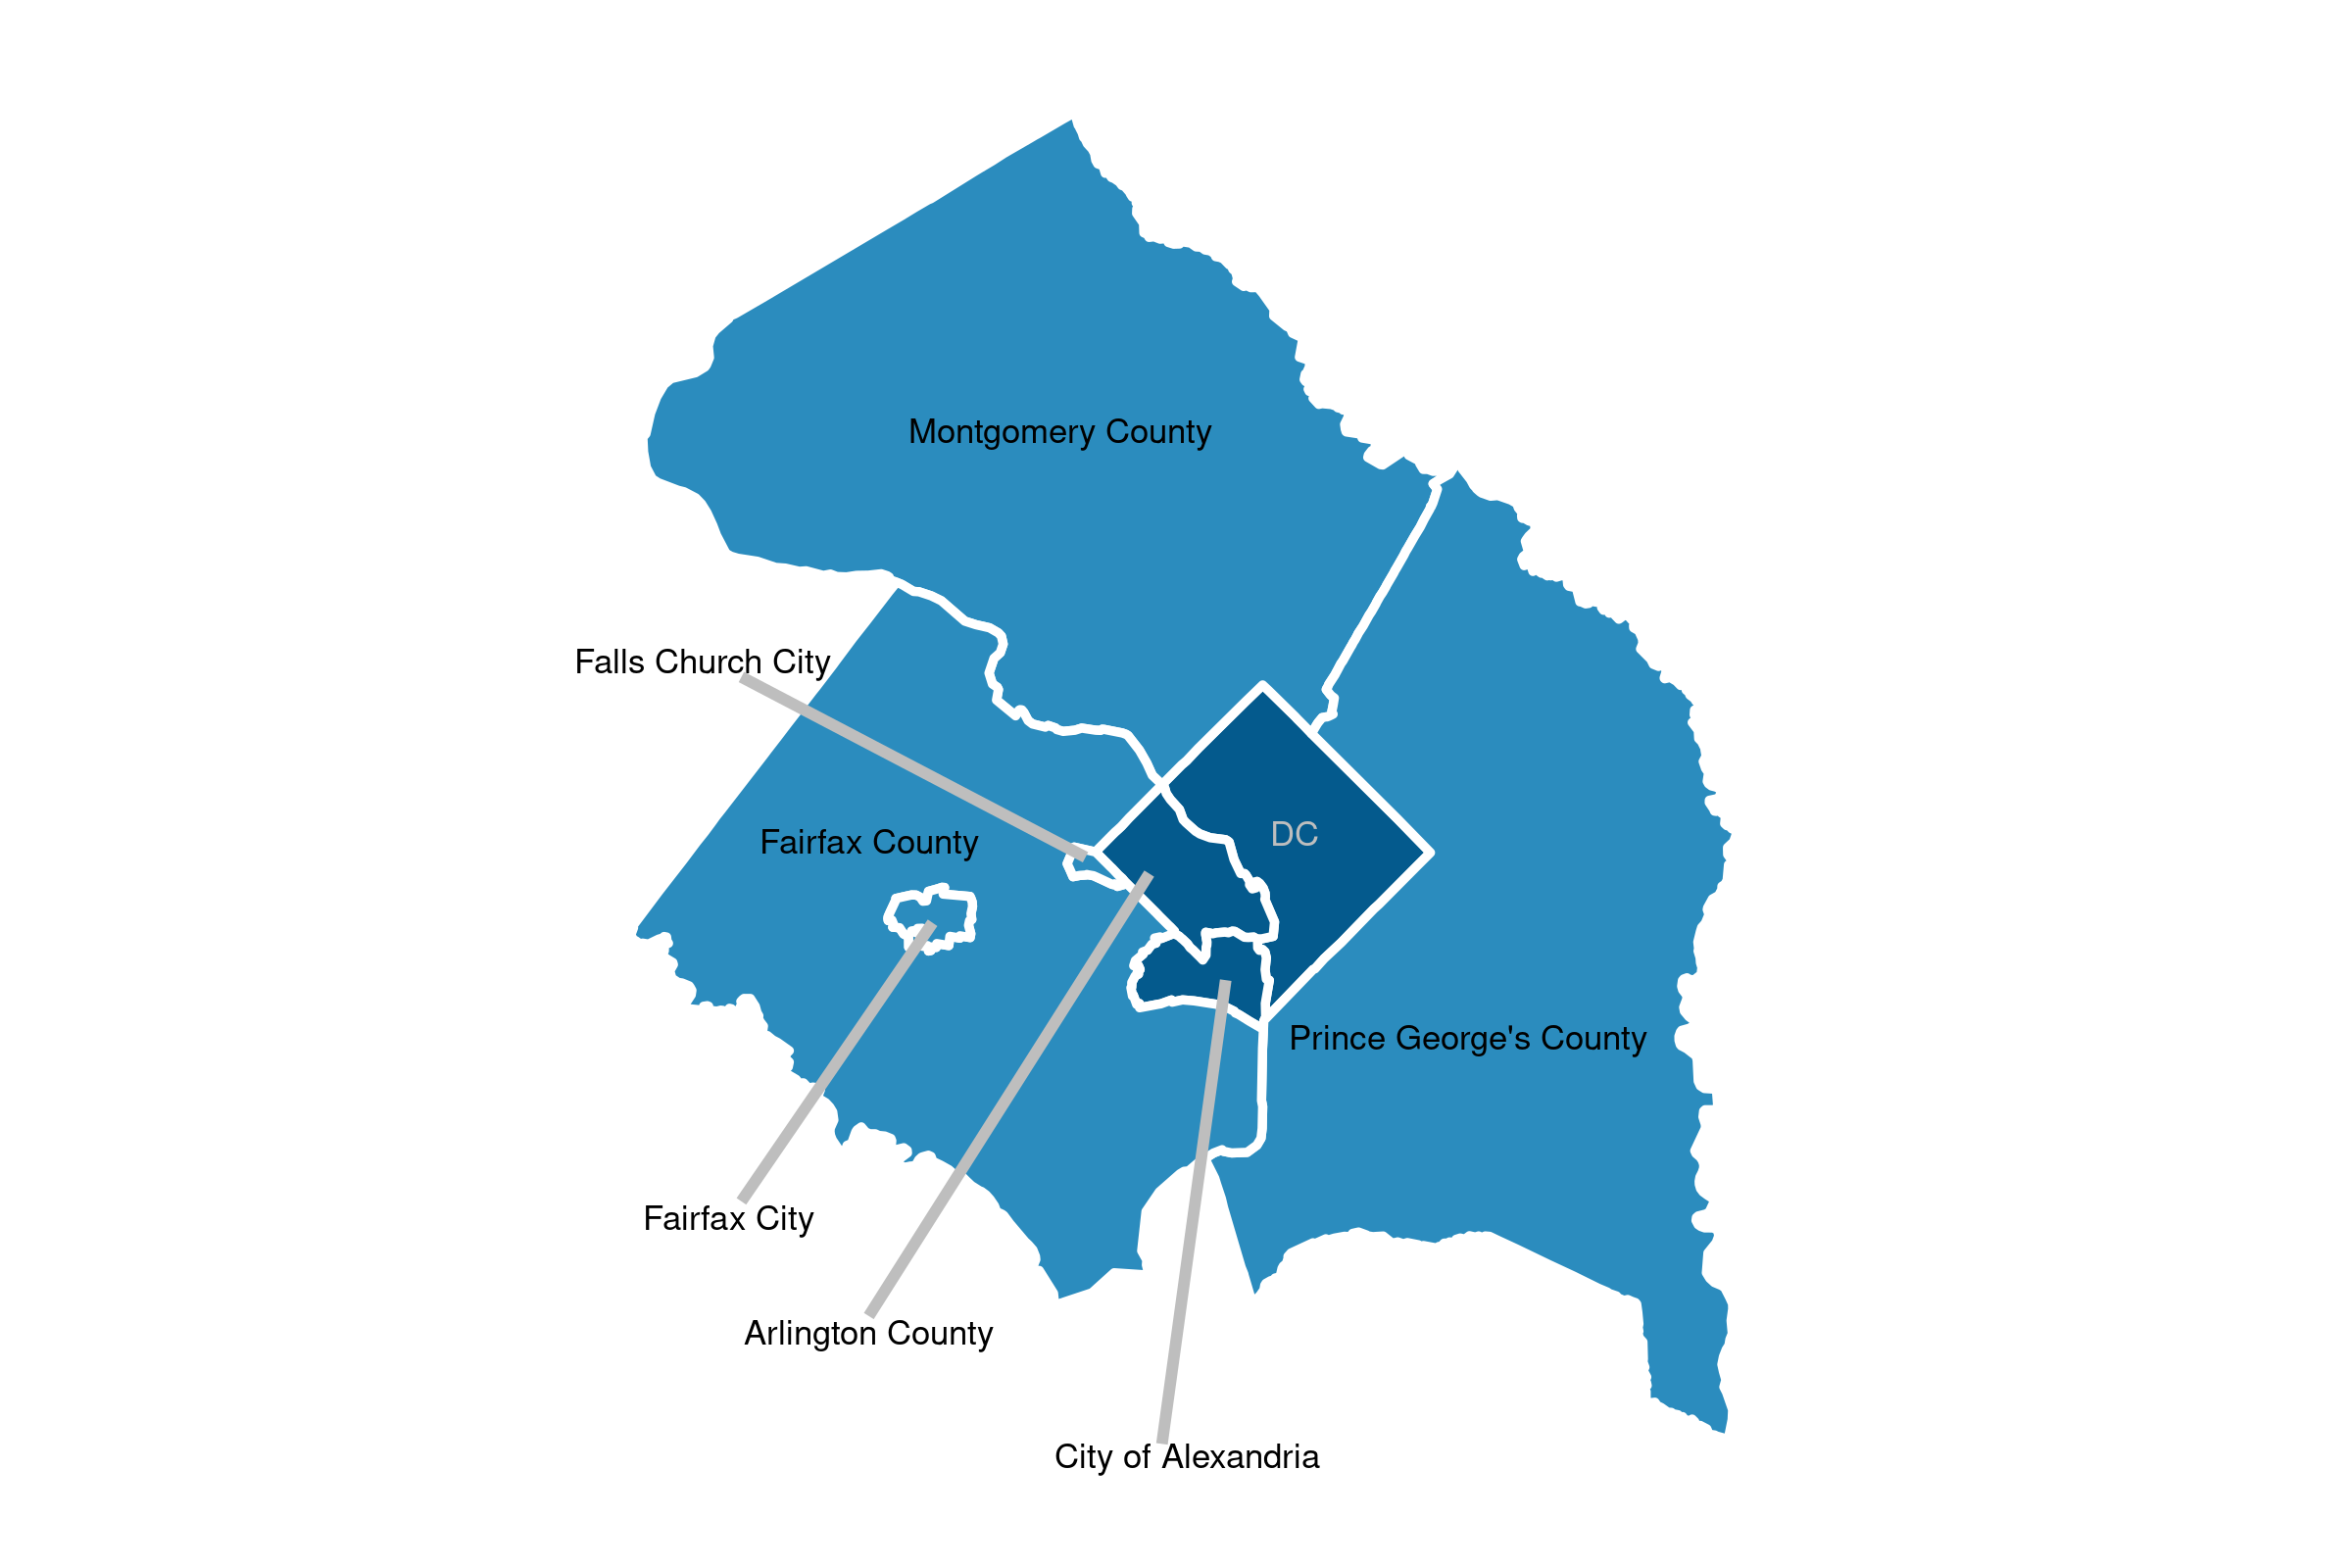
Source: Census Bureau, 2010 jurisdictional boundaries
Figure I.1A shows the urban jurisdictions in dark blue and the suburban jurisdictions in light blue.
Figure I.1B: Jurisdictions of the Capital Region
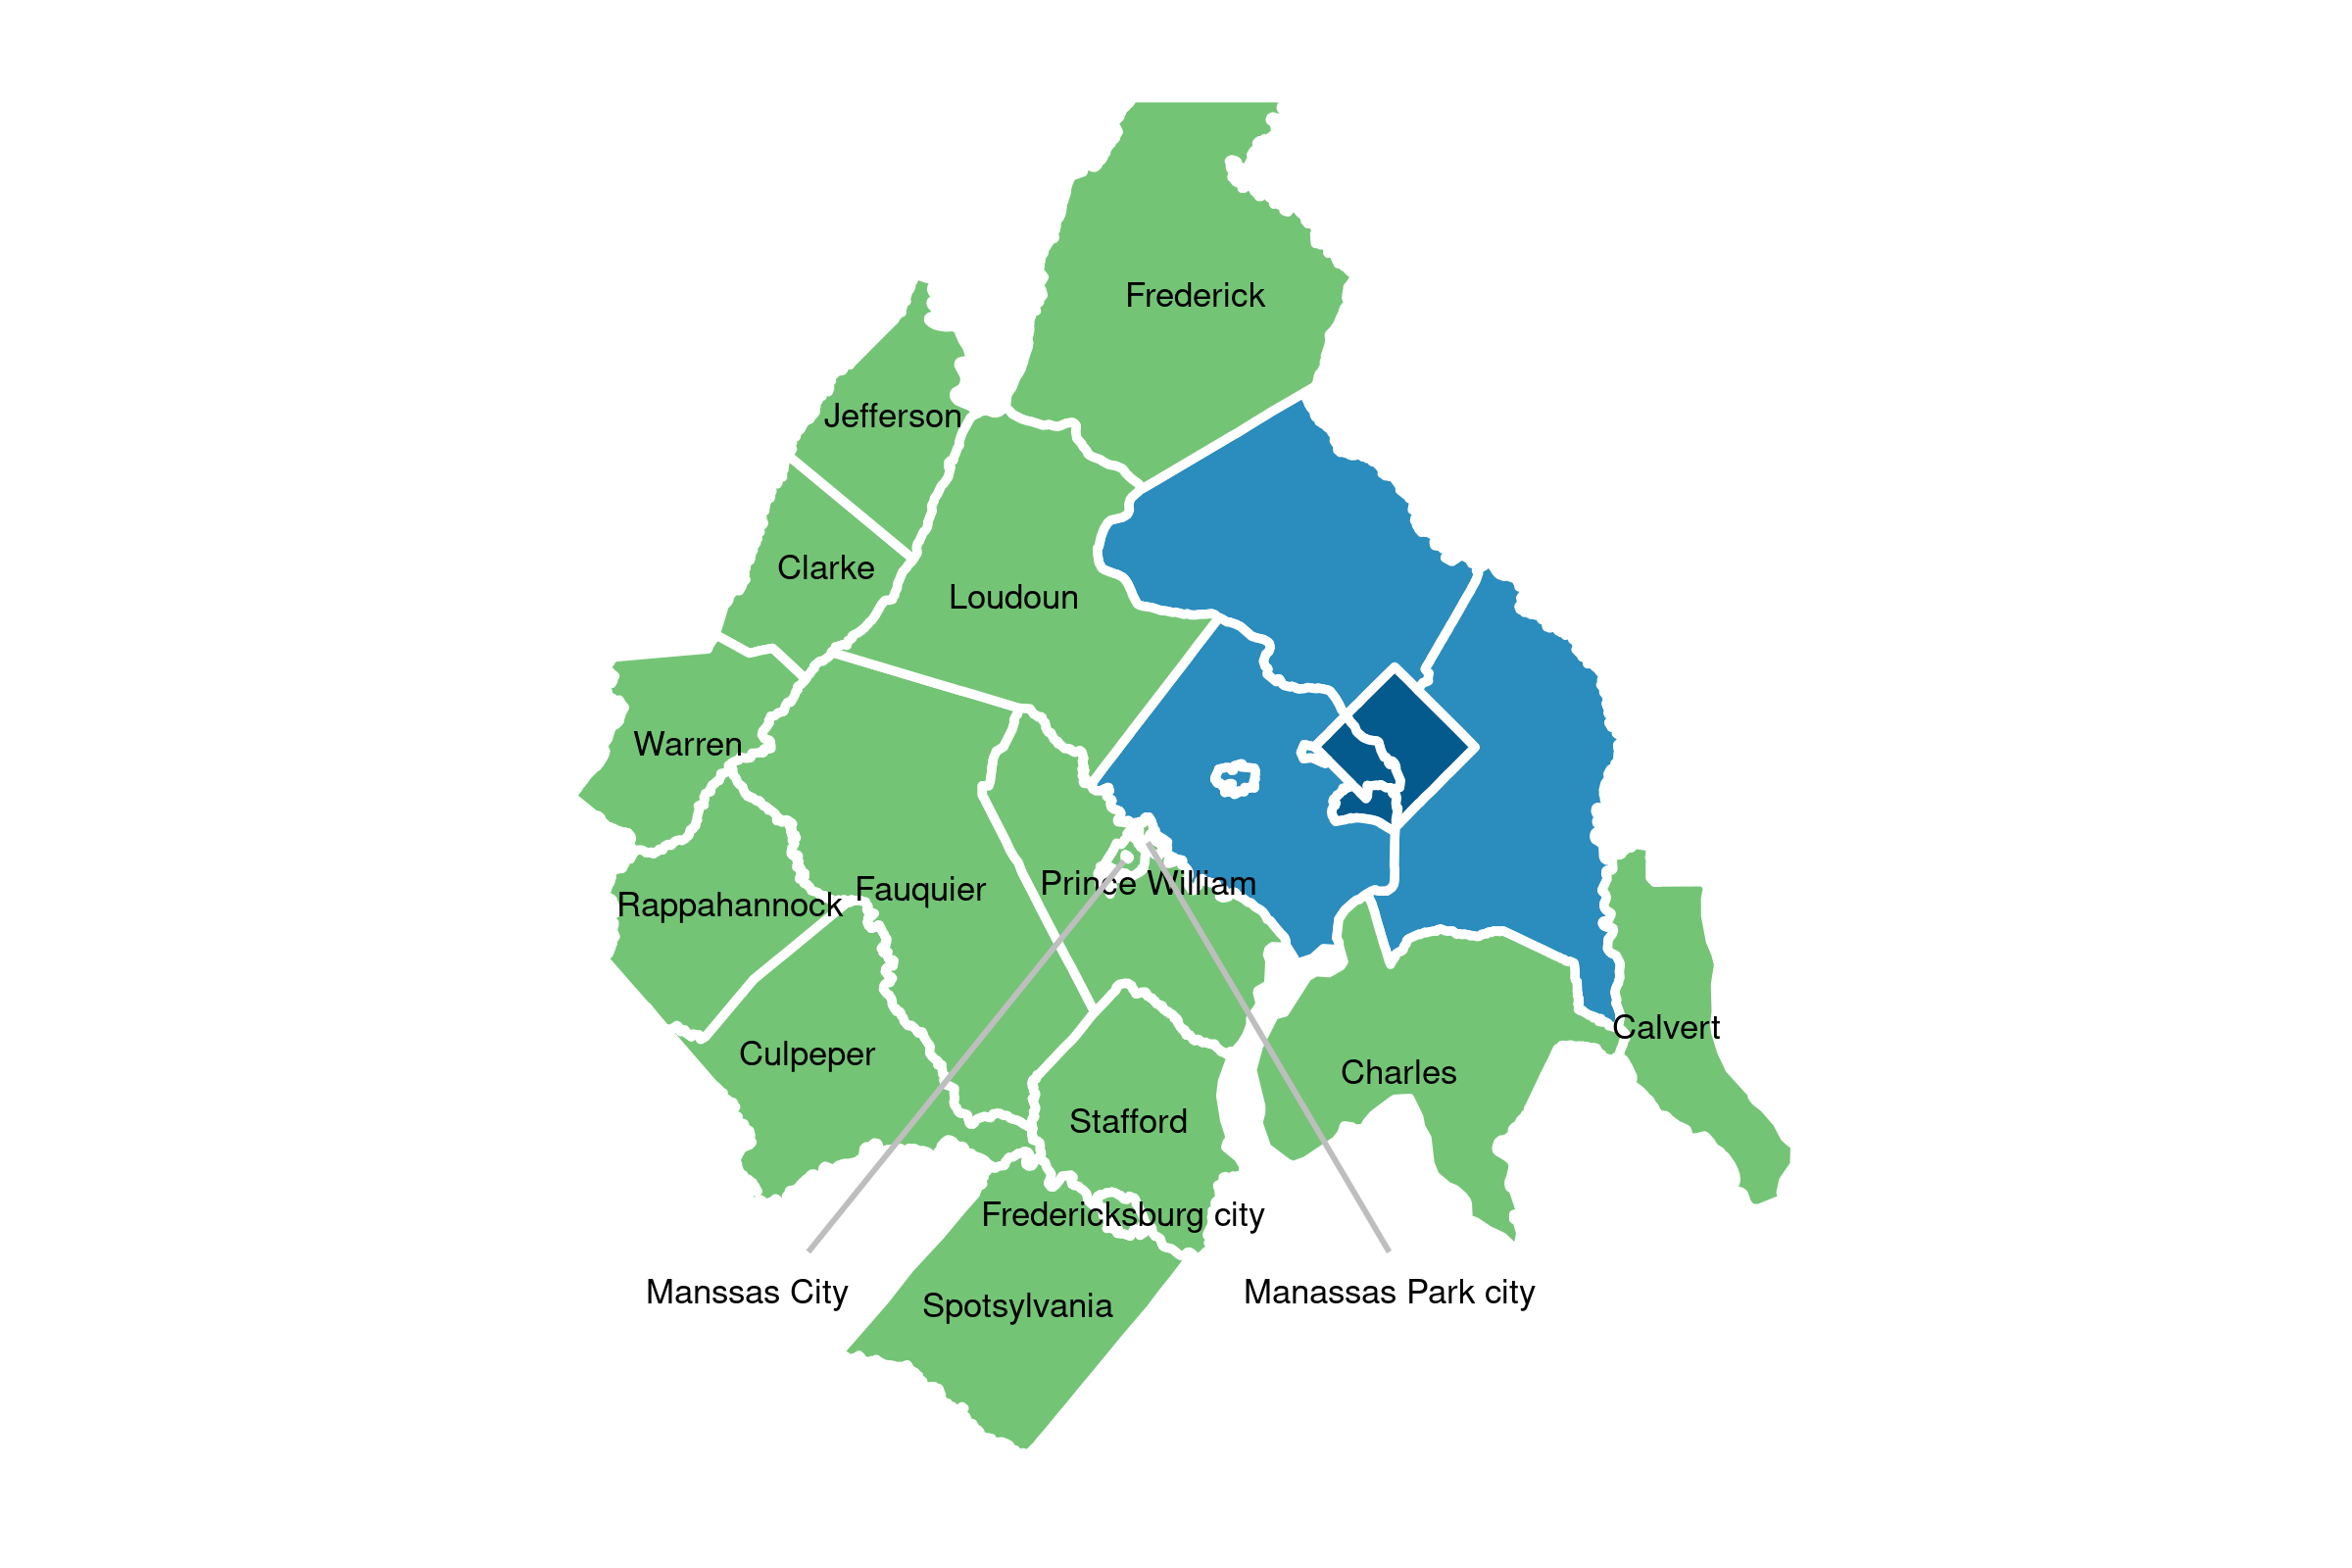
Source: Census Bureau, 2010 jurisdictional boundaries
Figure I.1B shows the exurban jurisdictions in green. The urban and suburban jurisdictions are in dark blue and light blue respectively.
Annual volumes of mortgage lending dropped precipitously during the Great Recession in all parts of the Capital Region, and remained below peak levels during the 2010s, as seen in Figure I.2. When the pandemic hit in early 2020, the region had very nearly returned to pre-recession levels of mortgage activity.
Figure I.2: Pandemic Supercharges the Capital Region Mortgage Market
Annual home purchase loan volume 2007-2021, by urban, suburban, and exurban status
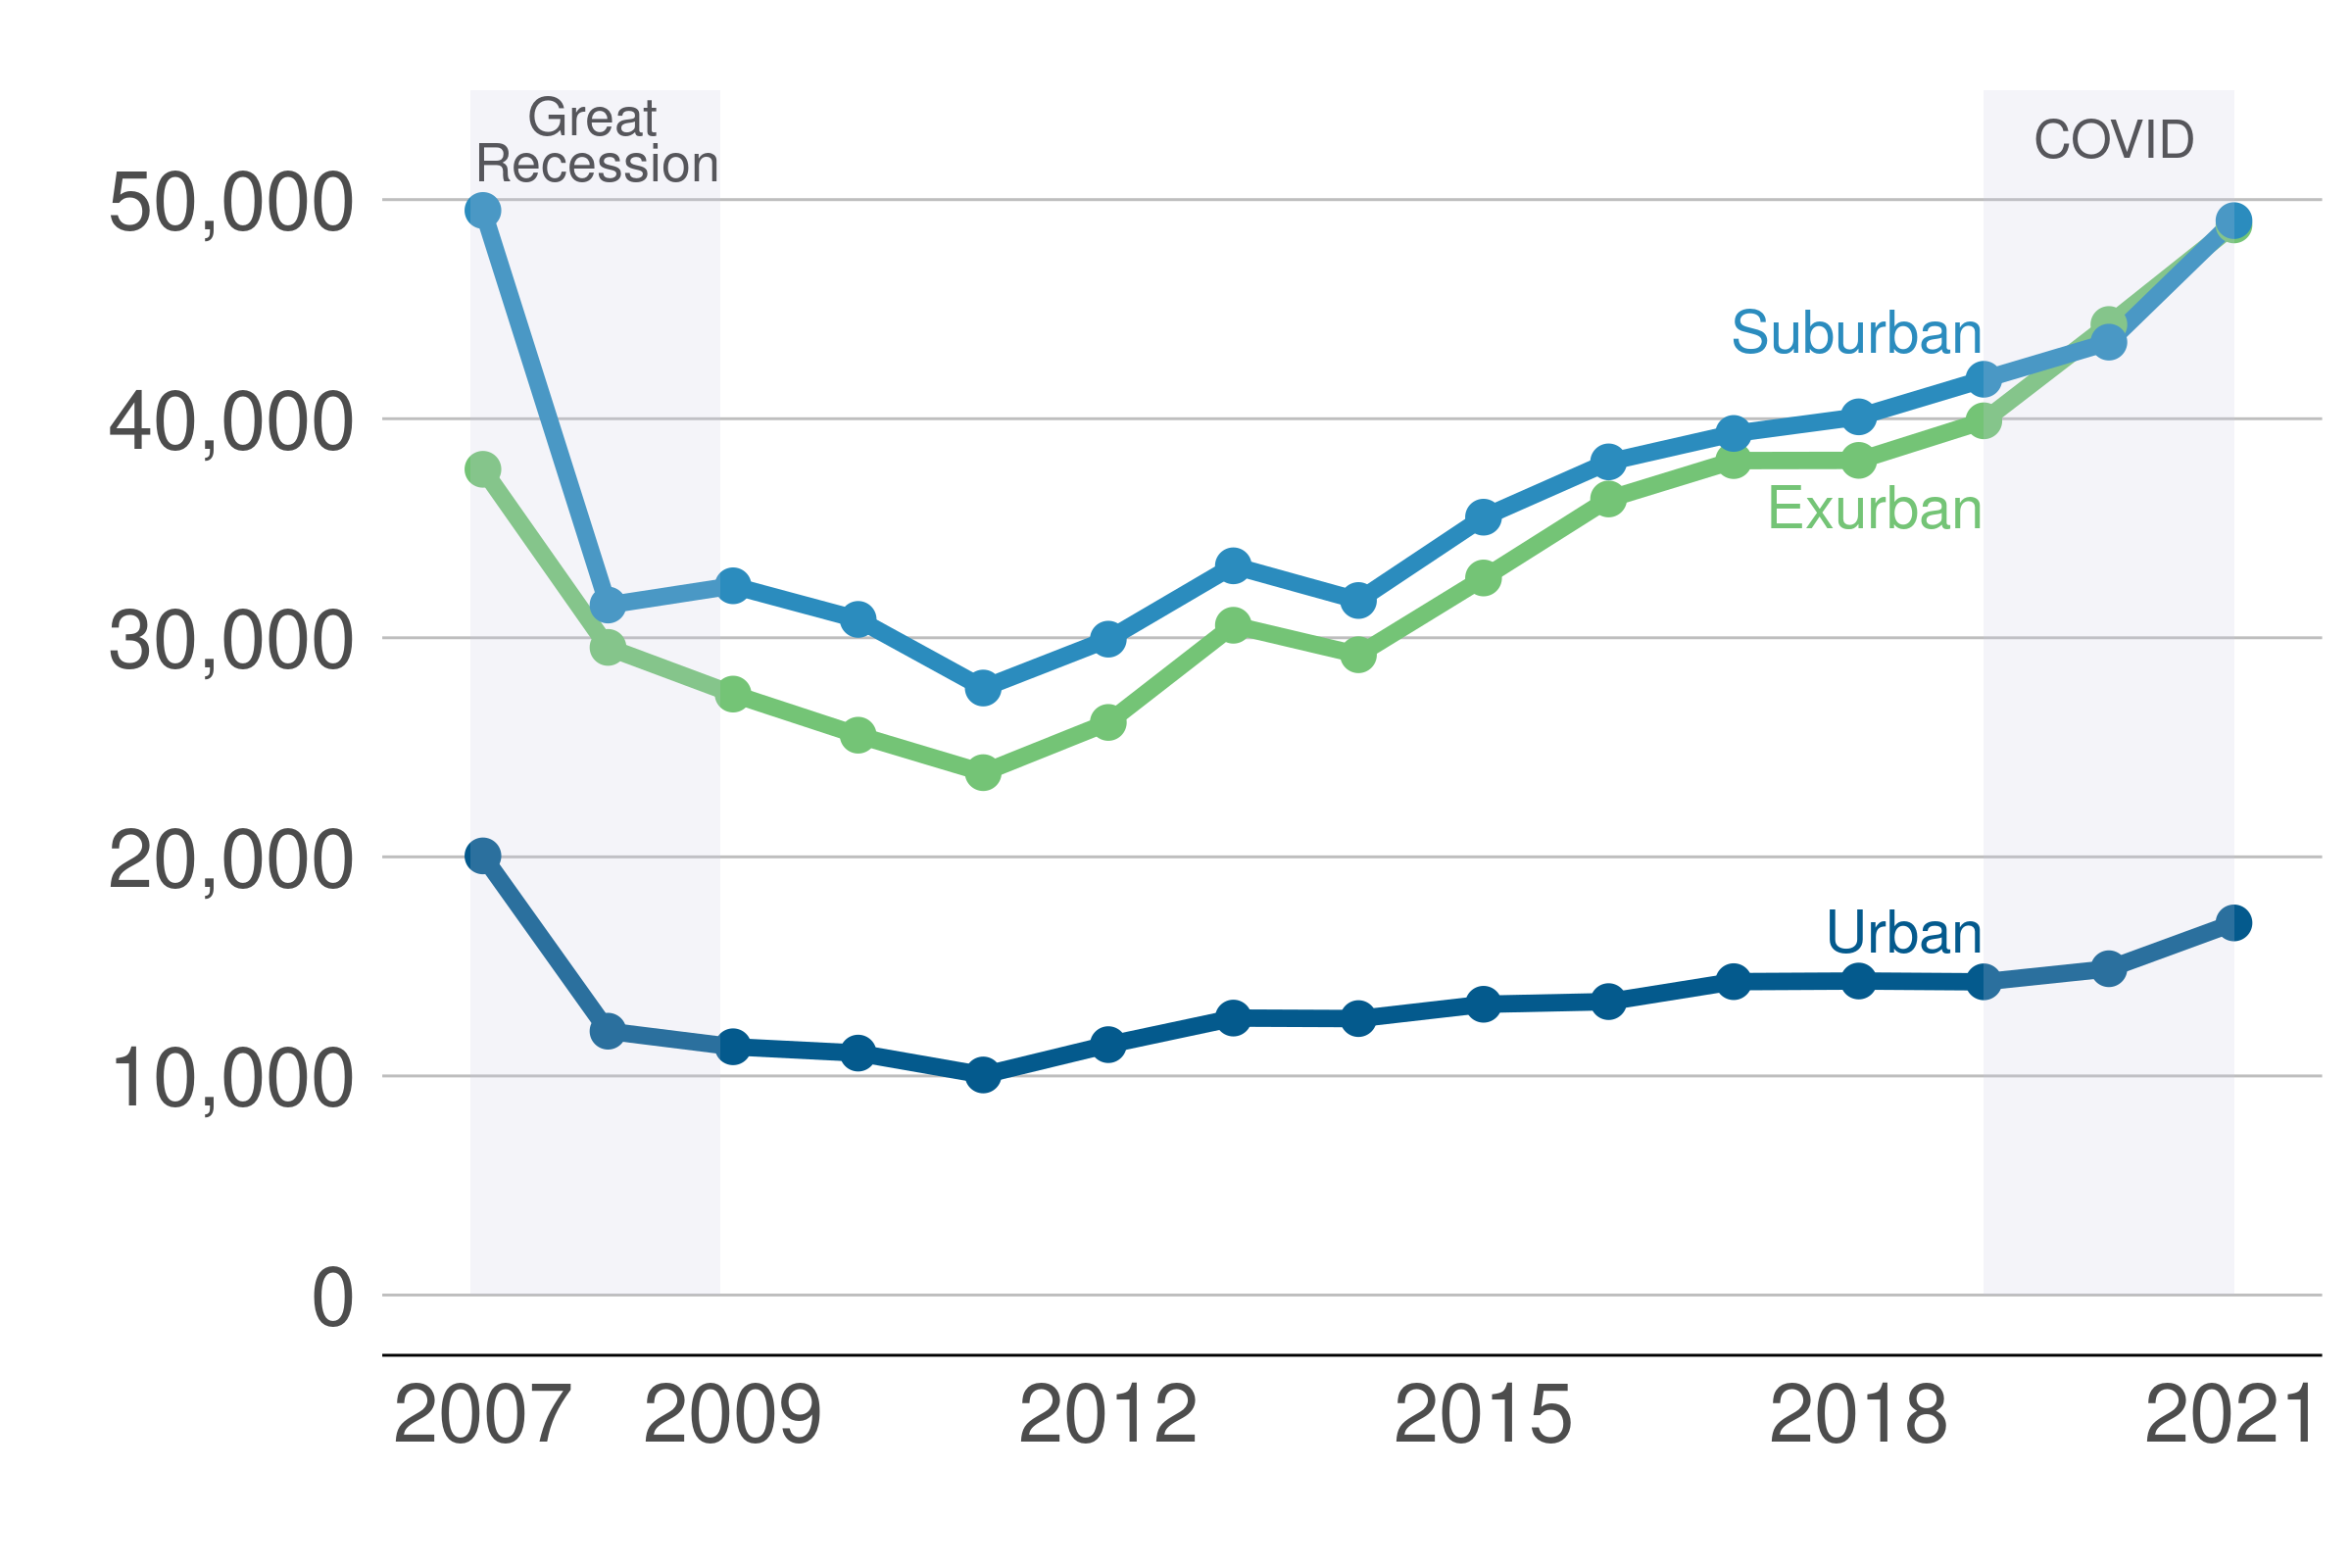
Source: HMDA, 2007-2021.
During the height of the pandemic, amid record low interest rates and a sharp increase in telecommuting, the number of mortgage loans increased even more—by 20 percent from 2019 to 2021.
In 2023, as interest rates are increasing, we see signs that mortgage lending is slowing. While Capital Region data are not yet available, national data clearly show a decline in the volume of home purchase mortgages. In addition, unsurprisingly, homeowners were refinancing mortgages at the beginning of 2023 less than in any of the past five years. If the past is any indication, mortgage behavior in the Capital Region will follow the national market closely.
We also find that, despite some media reports of a potentially huge exodus from central, wealthy neighborhoods, higher income Capital Region recent homebuyers slightly changed preferences for locations farther from the center. That said, higher income recent homebuyers remain concentrated relatively close to the Central Business District.
The rest of this report examines these issues in greater detail. In Chapter 1, we explore Capital Region homebuying patterns in the wake of the Great Recession through 2019. The second chapter considers the impact of COVID-19 on homebuying, and the final chapter examines the income patterns of recent homebuyers.