Chapter 2: Did the pandemic change Capital Region homebuying patterns?
As we come out of the COVID-19 pandemic, a major question is how housing and mortgage markets have changed. In particular, to what extent have pre-pandemic trends continued? To what extent do we see changes in people’s home-buying decisions?
Figure 2.1: Median loan amounts are higher than before the pandemic
Median loan value for purchase loans by urban, suburban, and exurban status, 2016-2021, 2021 dollars
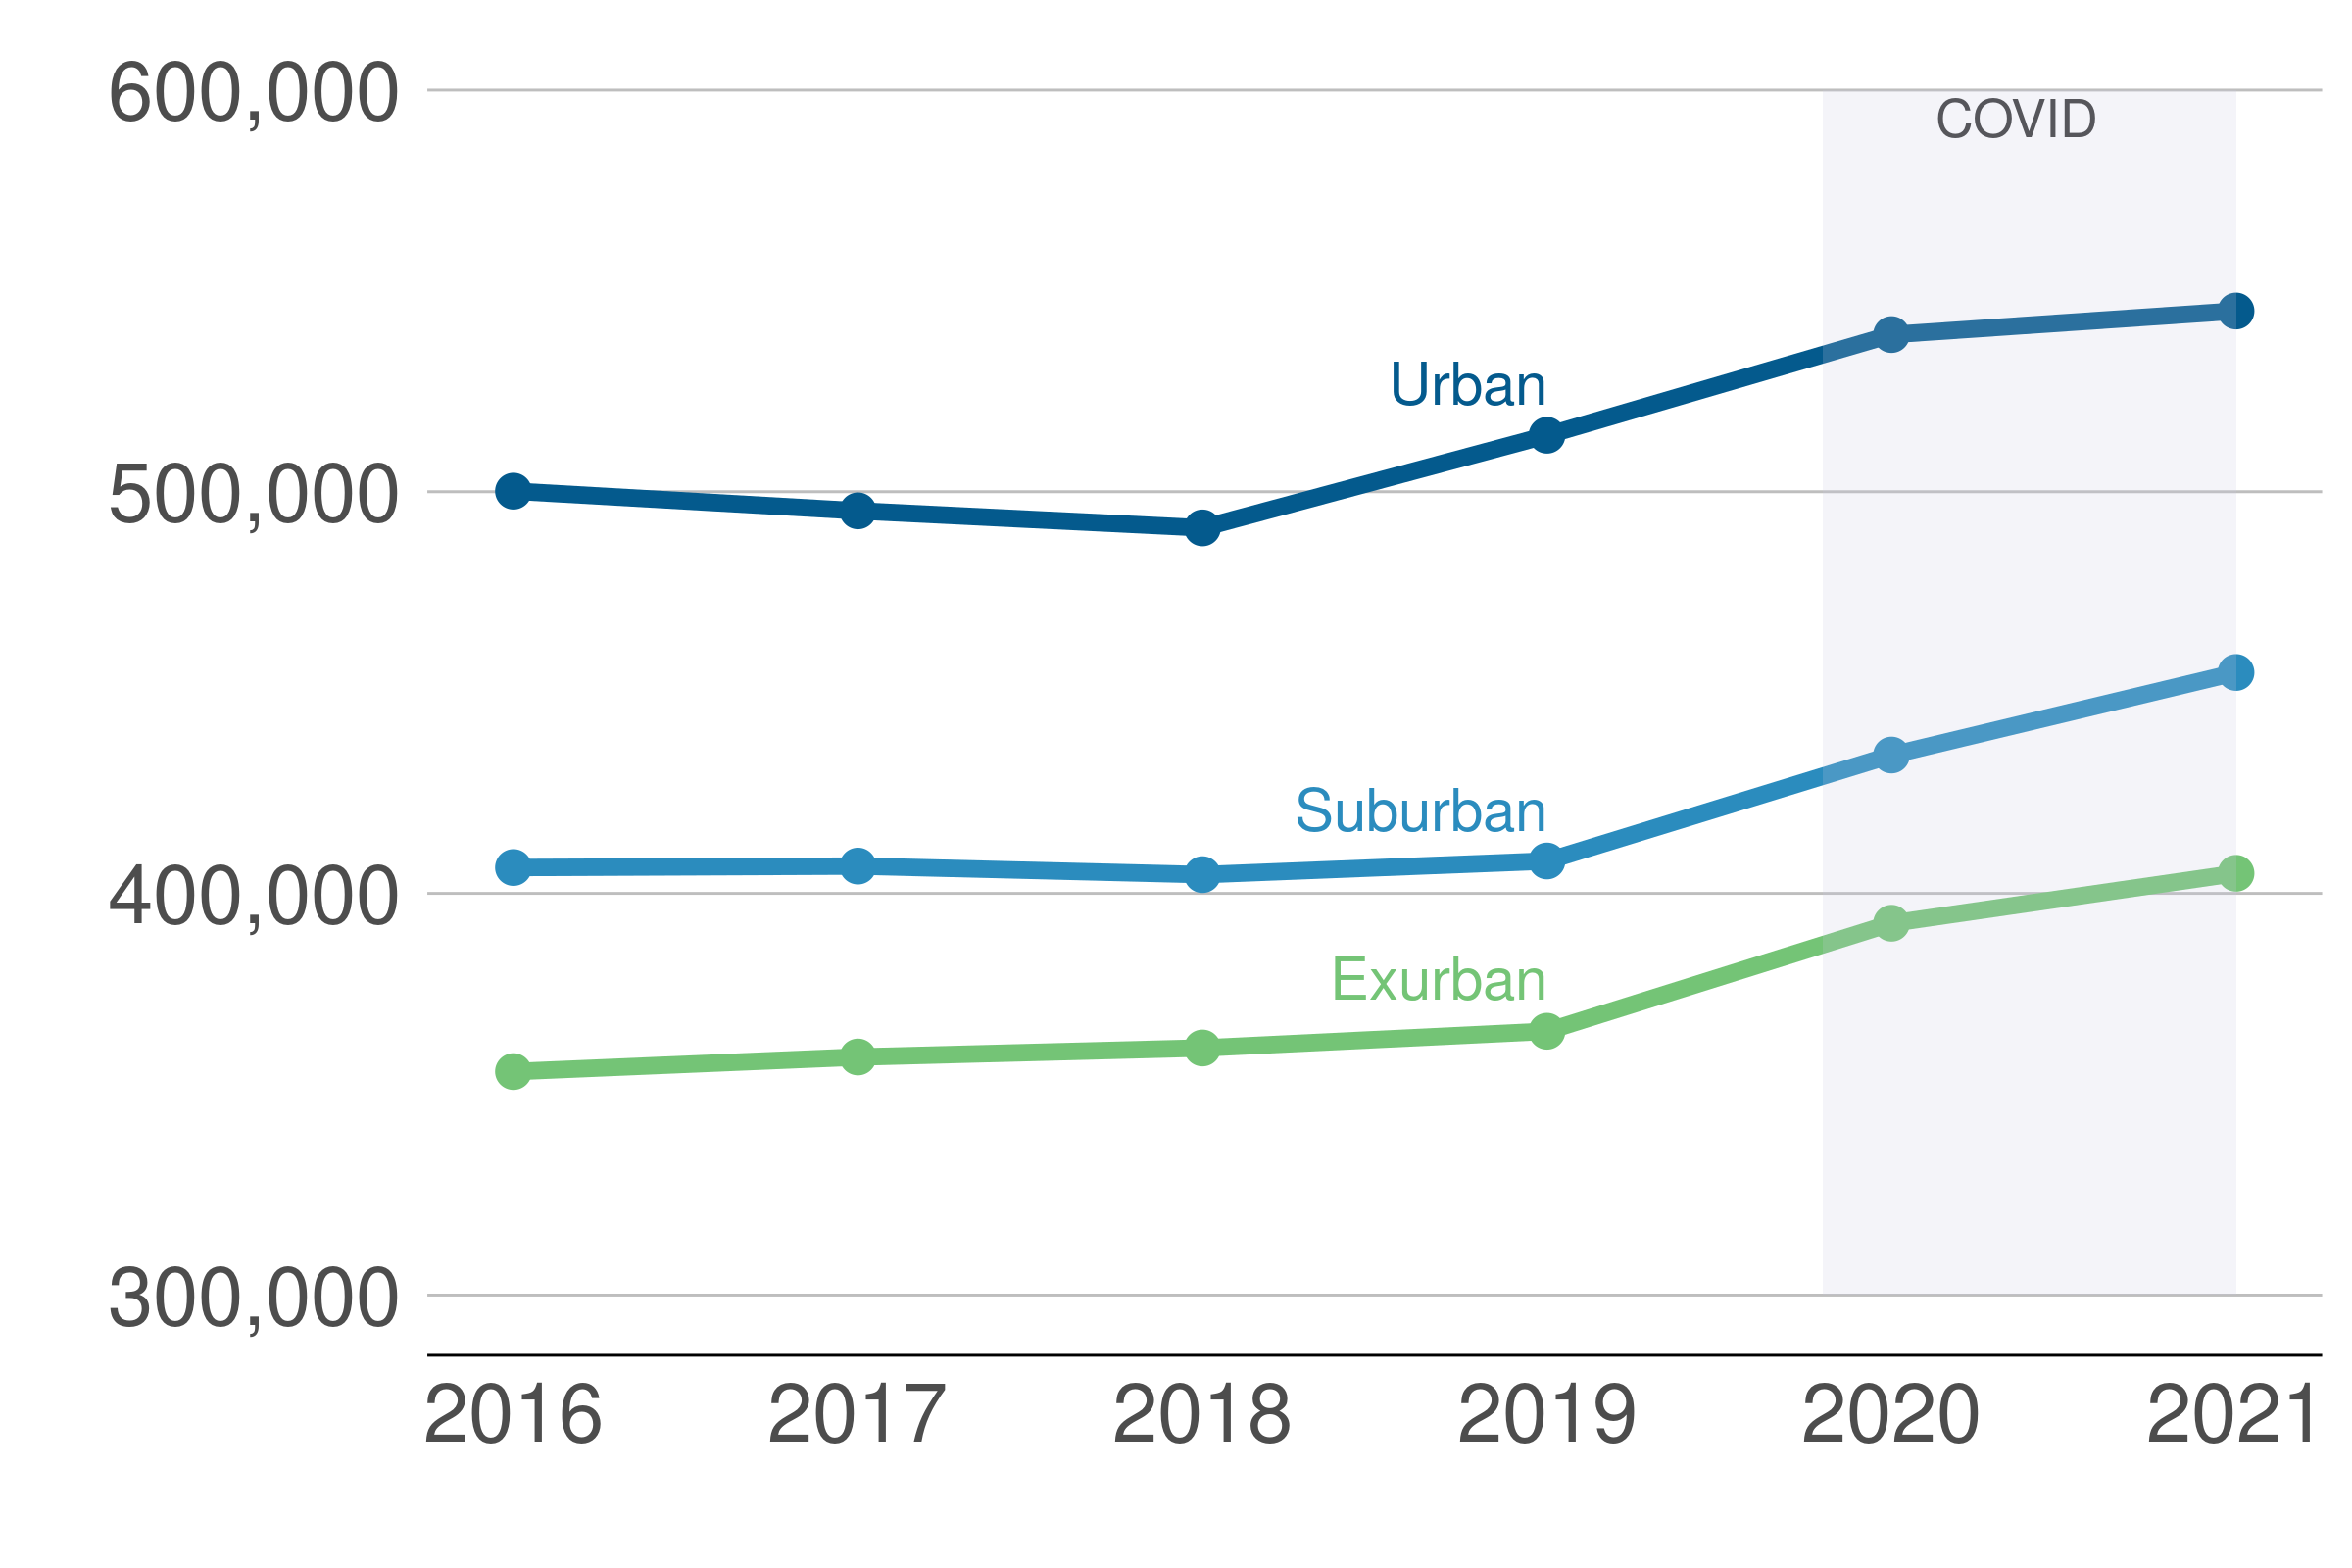
Source: HMDA, 2016-2021.
Figure 2.1 provides an initial big-picture look. After remaining flat during the years leading up to the pandemic, mortgage loan sizes increased significantly in 2020 and 2021. Increases occurred in all types of jurisdictions—exurban, suburban, and urban. In exurban areas, the median loan grew by 11 percent; in suburban areas by 12 percent; and in urban areas by six percent. These increases coincide with national patterns. During the pandemic, home prices rose faster in suburban and exurban areas than in urban areas. In absolute terms, the median new mortgage in exurban jurisdictions sits at about $400,000, while the corresponding numbers for suburban and urban jurisdictions are $450,000 and $550,000.
Figure 2.2: Median home purchase loan value increased more farther from the Central Business District
Percentage change in median loan value by distance to the White House, 2018 & 2019 vs. 2020 & 2021
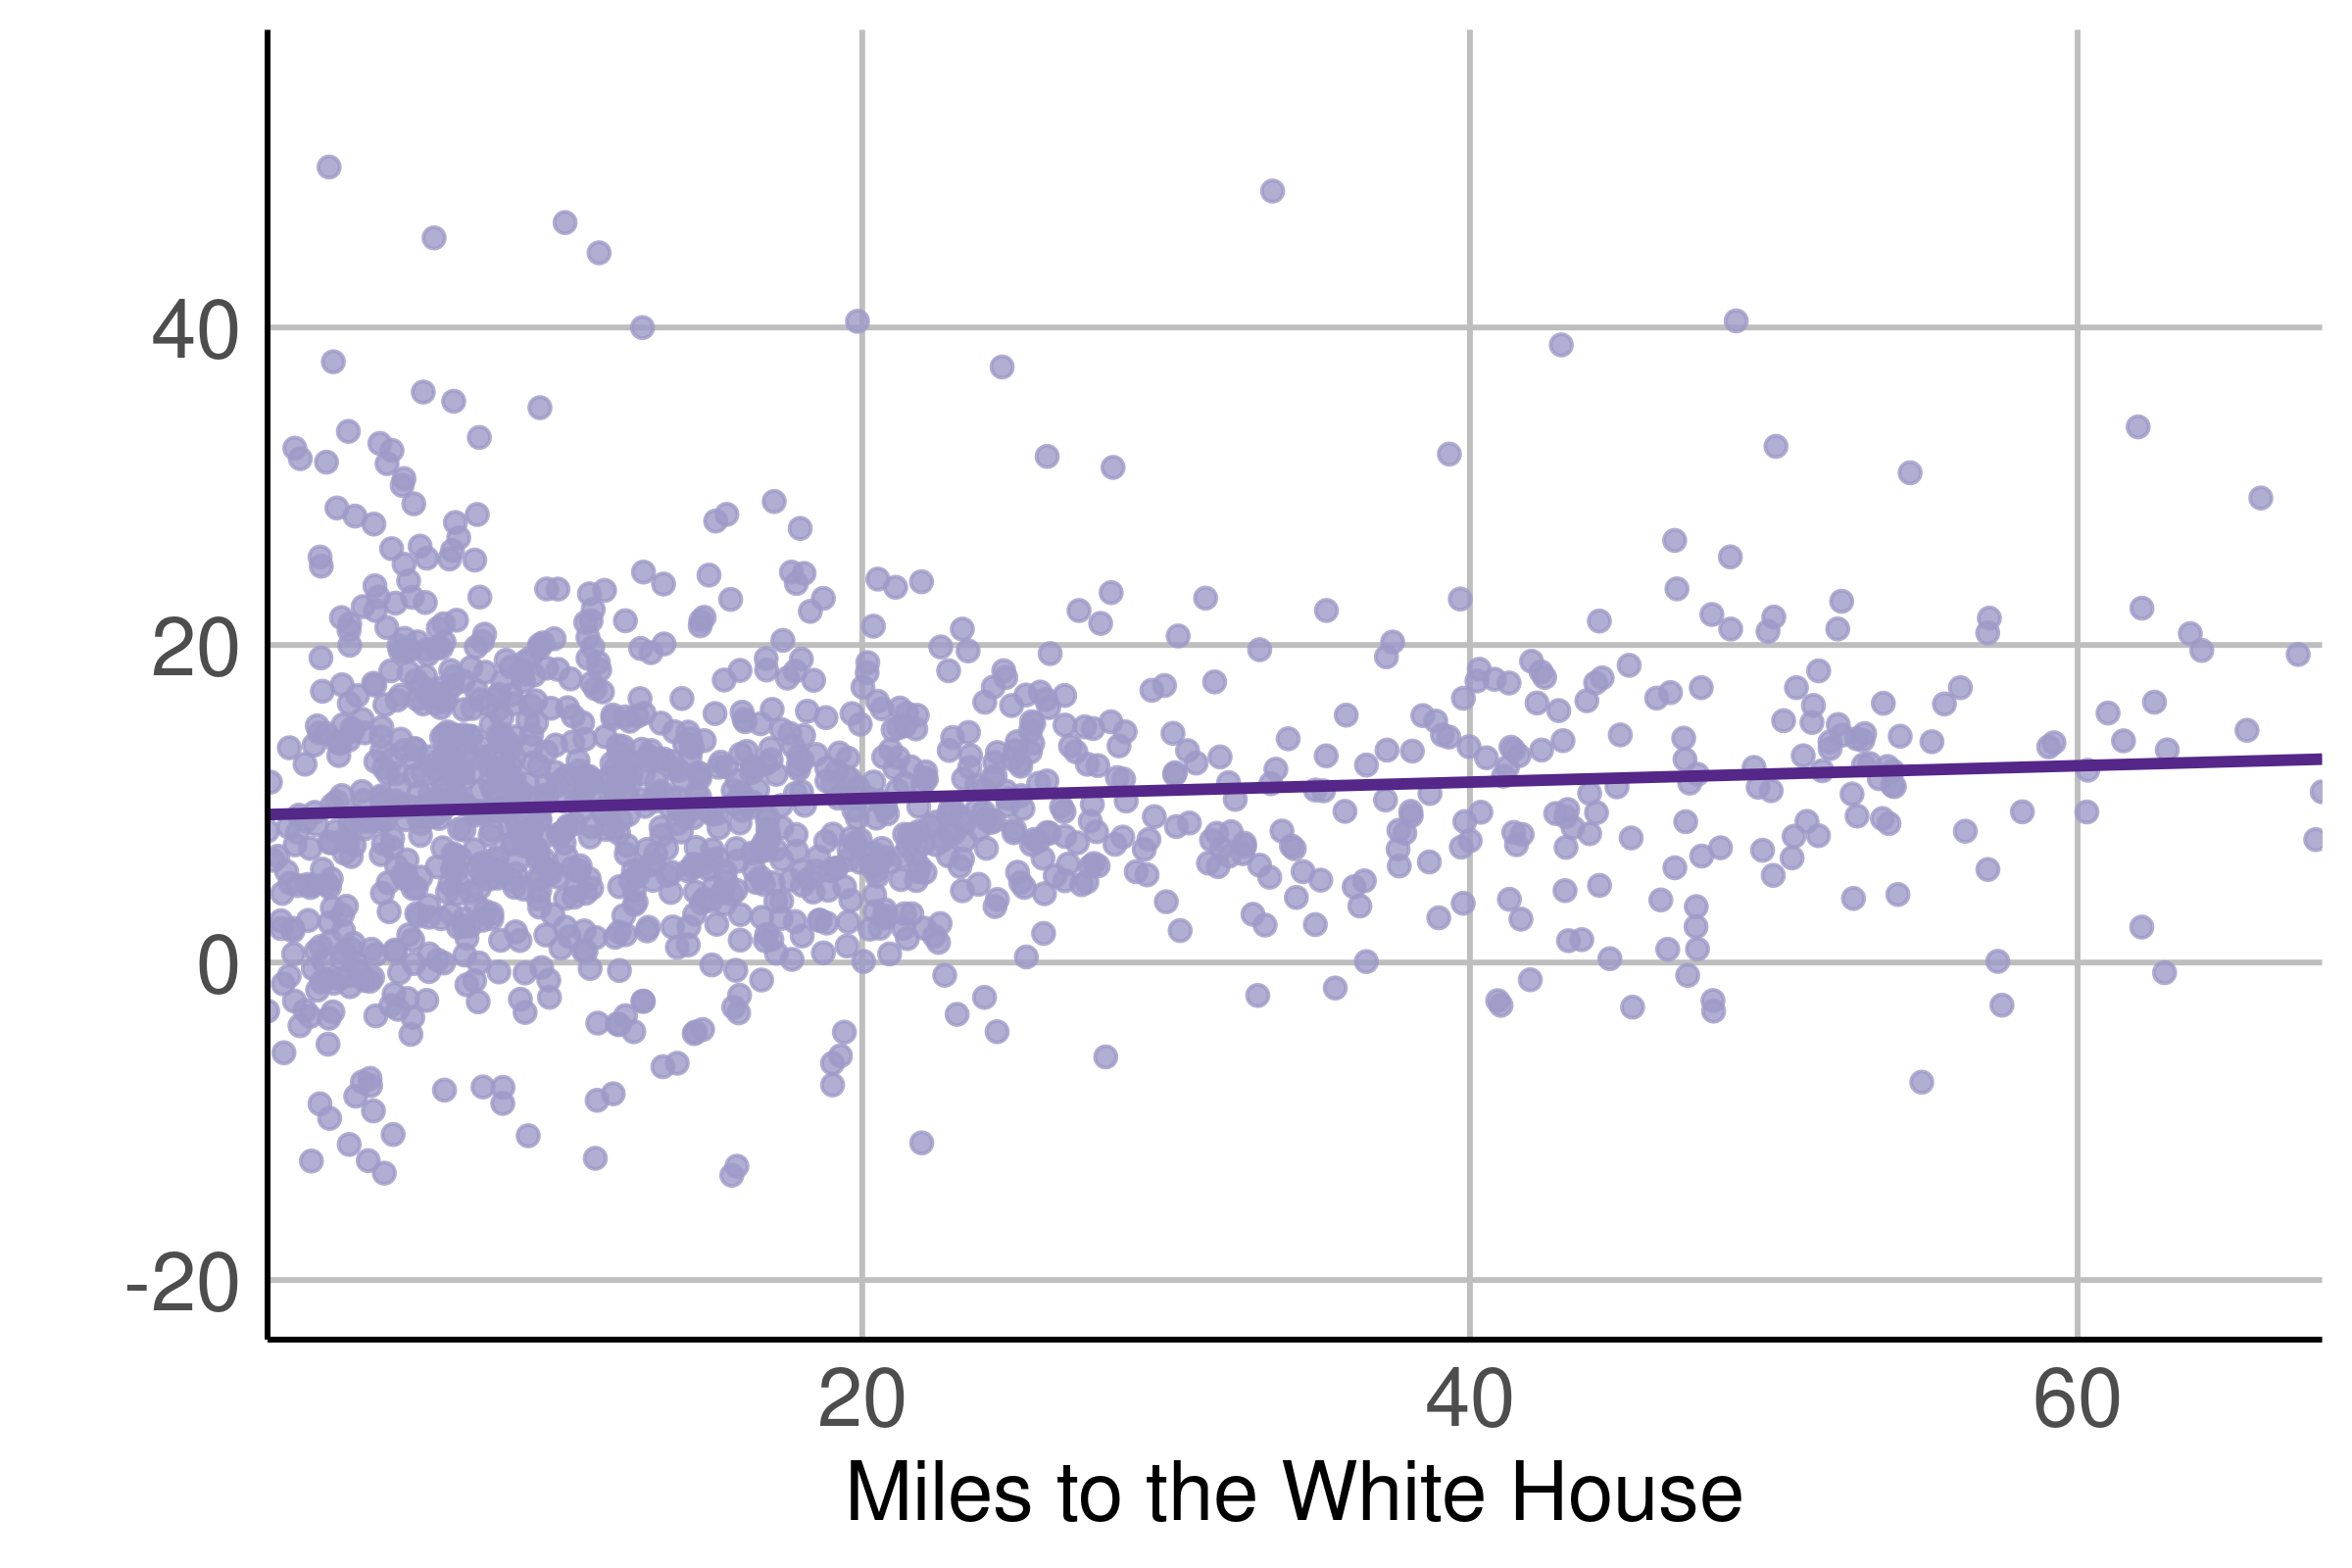
Source: HMDA, 2018-2021. Notes: This figure compares, for each neighborhood, the average of the median loan values for 2020 and 2021 to the average of the median loan values for 2018 and 2019. We calculate the percentage change between these two values, relative to the 2018/2019 period. We report percent changes in the average of median loan values between the 2nd and 99th percentile of the loan value distribution.
Zooming in a bit more, Figure 2.2 captures some of these post-pandemic changes. The figure shows the change in median loan value by distance to the White House—a rough proxy for the District’s Central Business District—between the pre-pandemic years of 2018-2019 and the mid-pandemic years of 2020-2021. Two aspects of the changing regional mortgage market jump out. First, mortgage size increased across the board, as we saw in Figure 2.1. Even closer to the Central Business District, where increases were relatively muted, median loan value increased by over nine percent. Second, areas farther from the Central Business District saw large loan value increases. For each ten miles from the Central Business District, the average value of a mortgage grew by an additional half a percentage point.
Figure 2.3: Loan volume in the Capital Region grew rapidly during the pandemic
Total home purchase loans originated by urban, suburban, and exurban status, 2016-2021
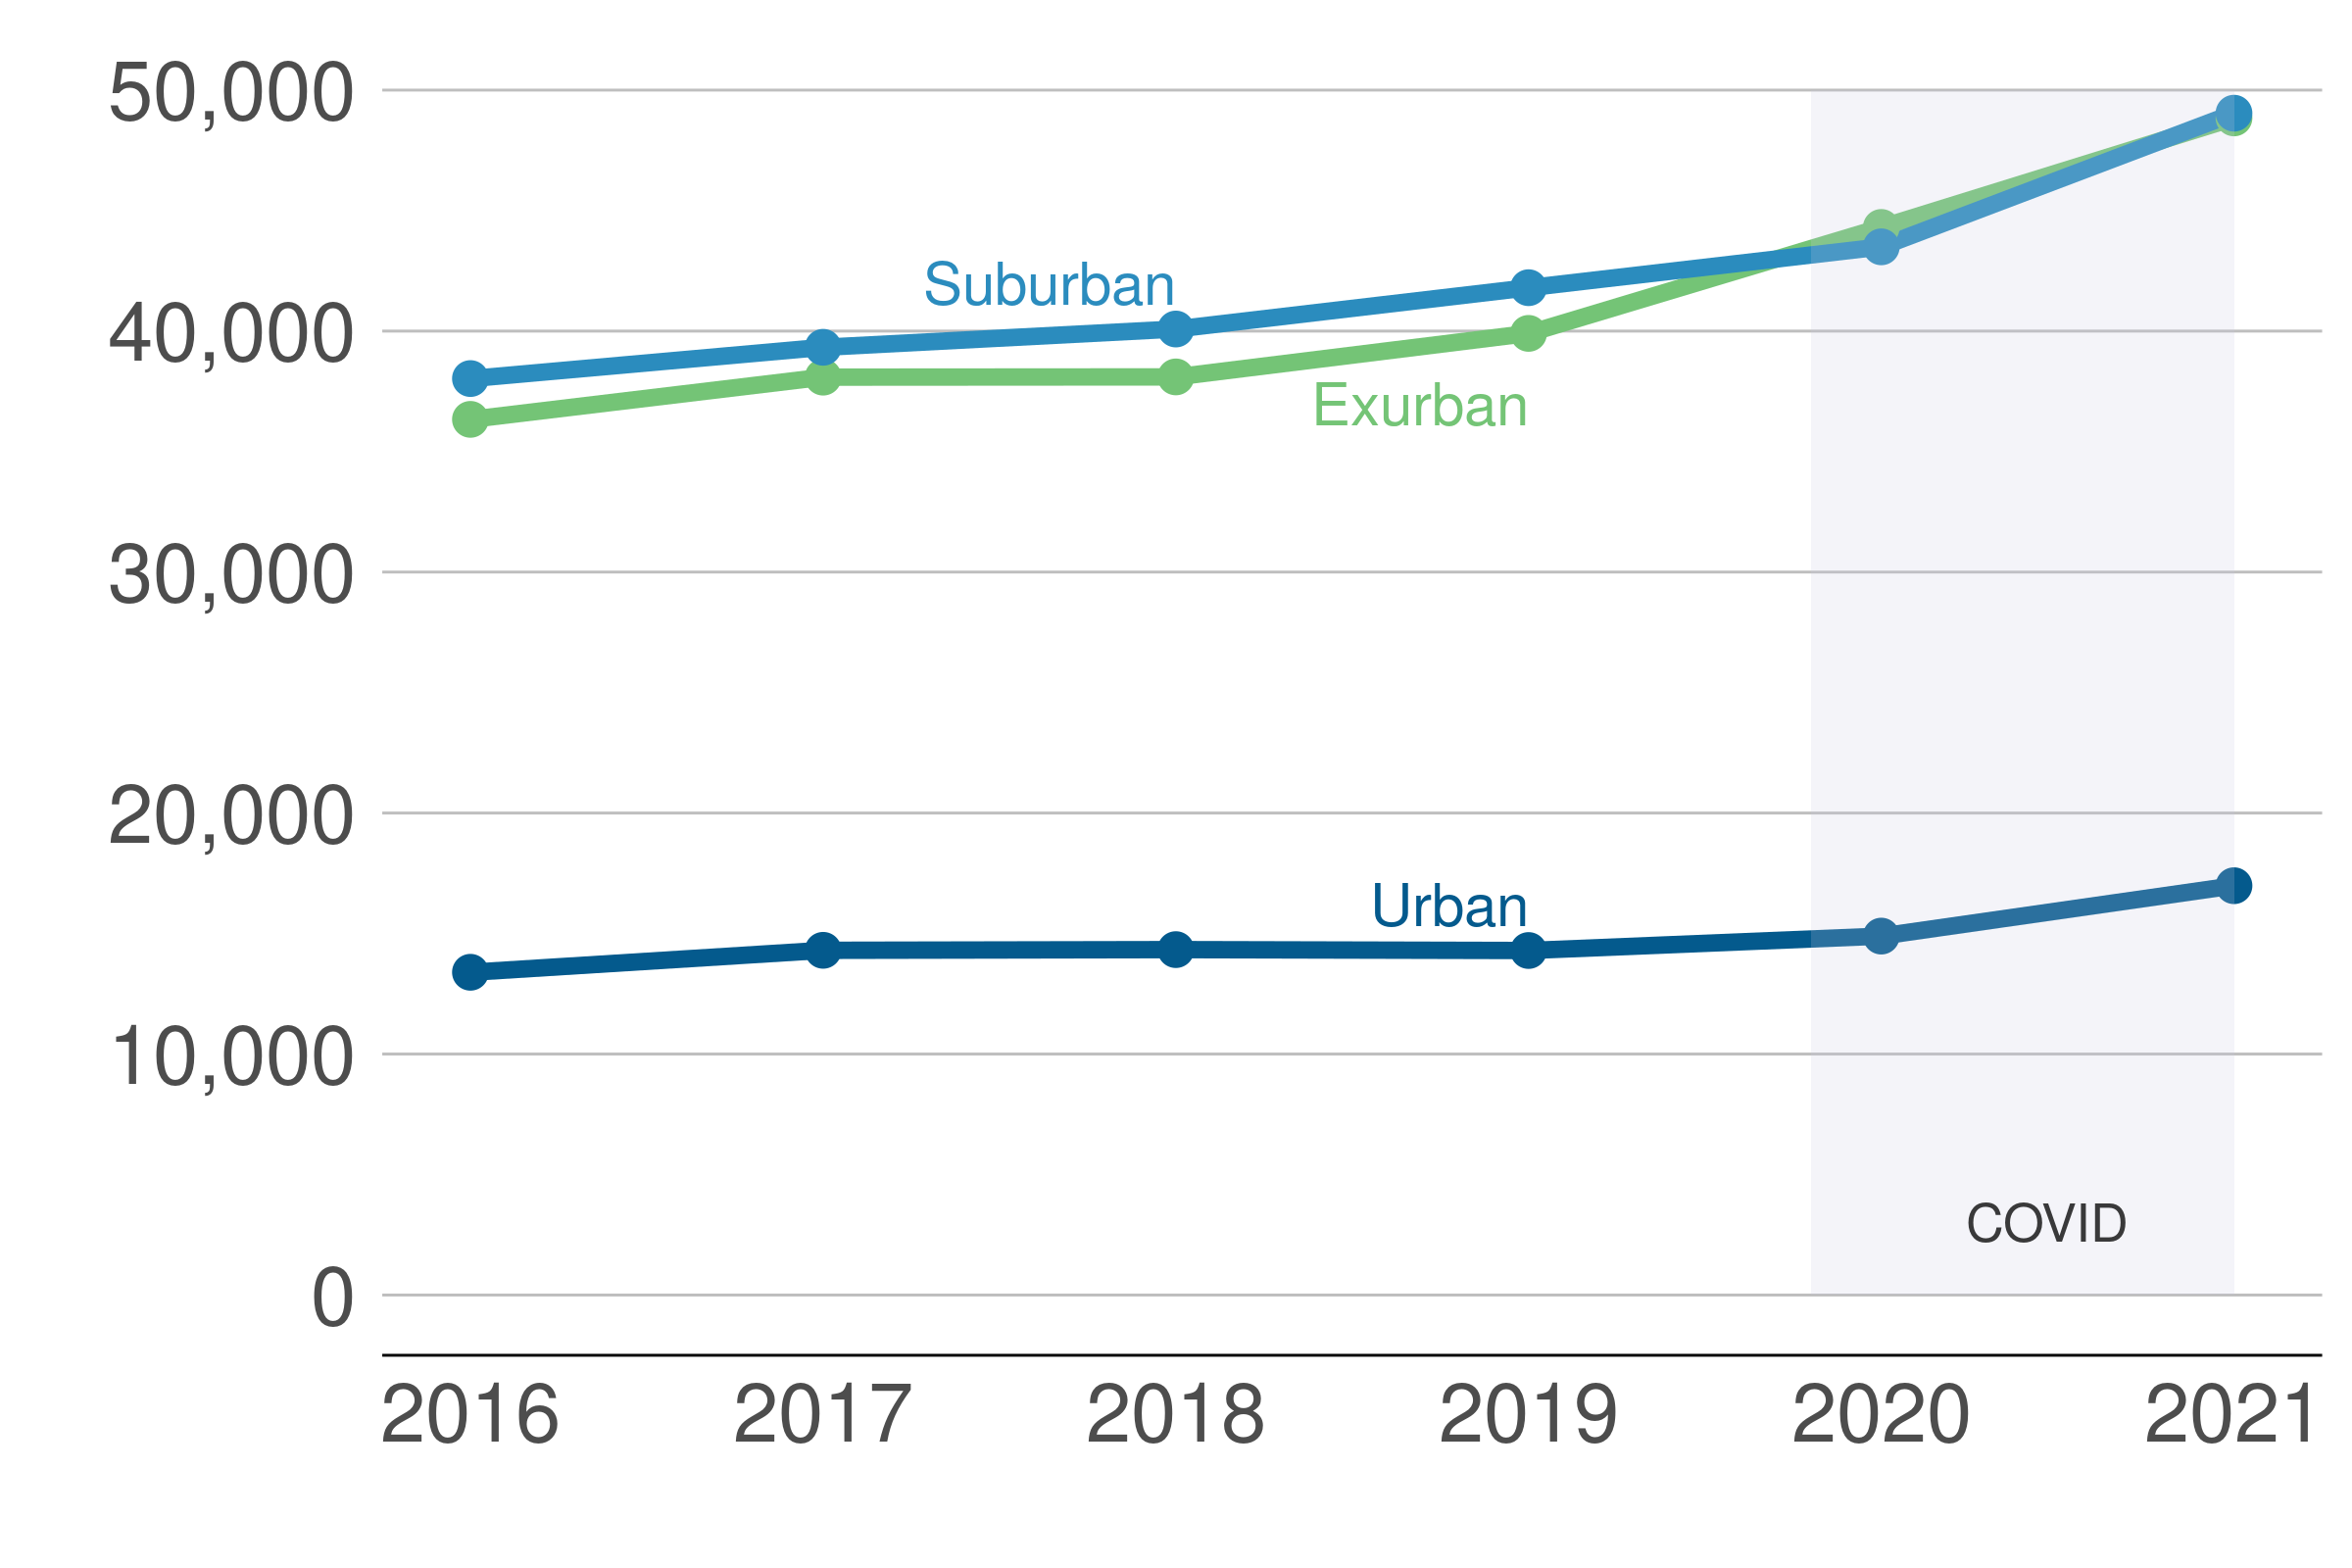
Source: HMDA, 2016-2021.
And, it is not just mortgage values that increased during the pandemic; the number of mortgages originated increased even more. As Figure 2.3 shows, the number of mortgages originated annually grew in all parts of the Capital Region. The number went up by as much as 22 percent in exurban jurisdictions from 2019 to 2021, but even urban areas witnessed growth of close to 20 percent.
Figure 2.4: Loan volume nationwide grew rapidly during the pandemic as well
Total home purchase loans originated relative to 2016 volume, 2016-2021
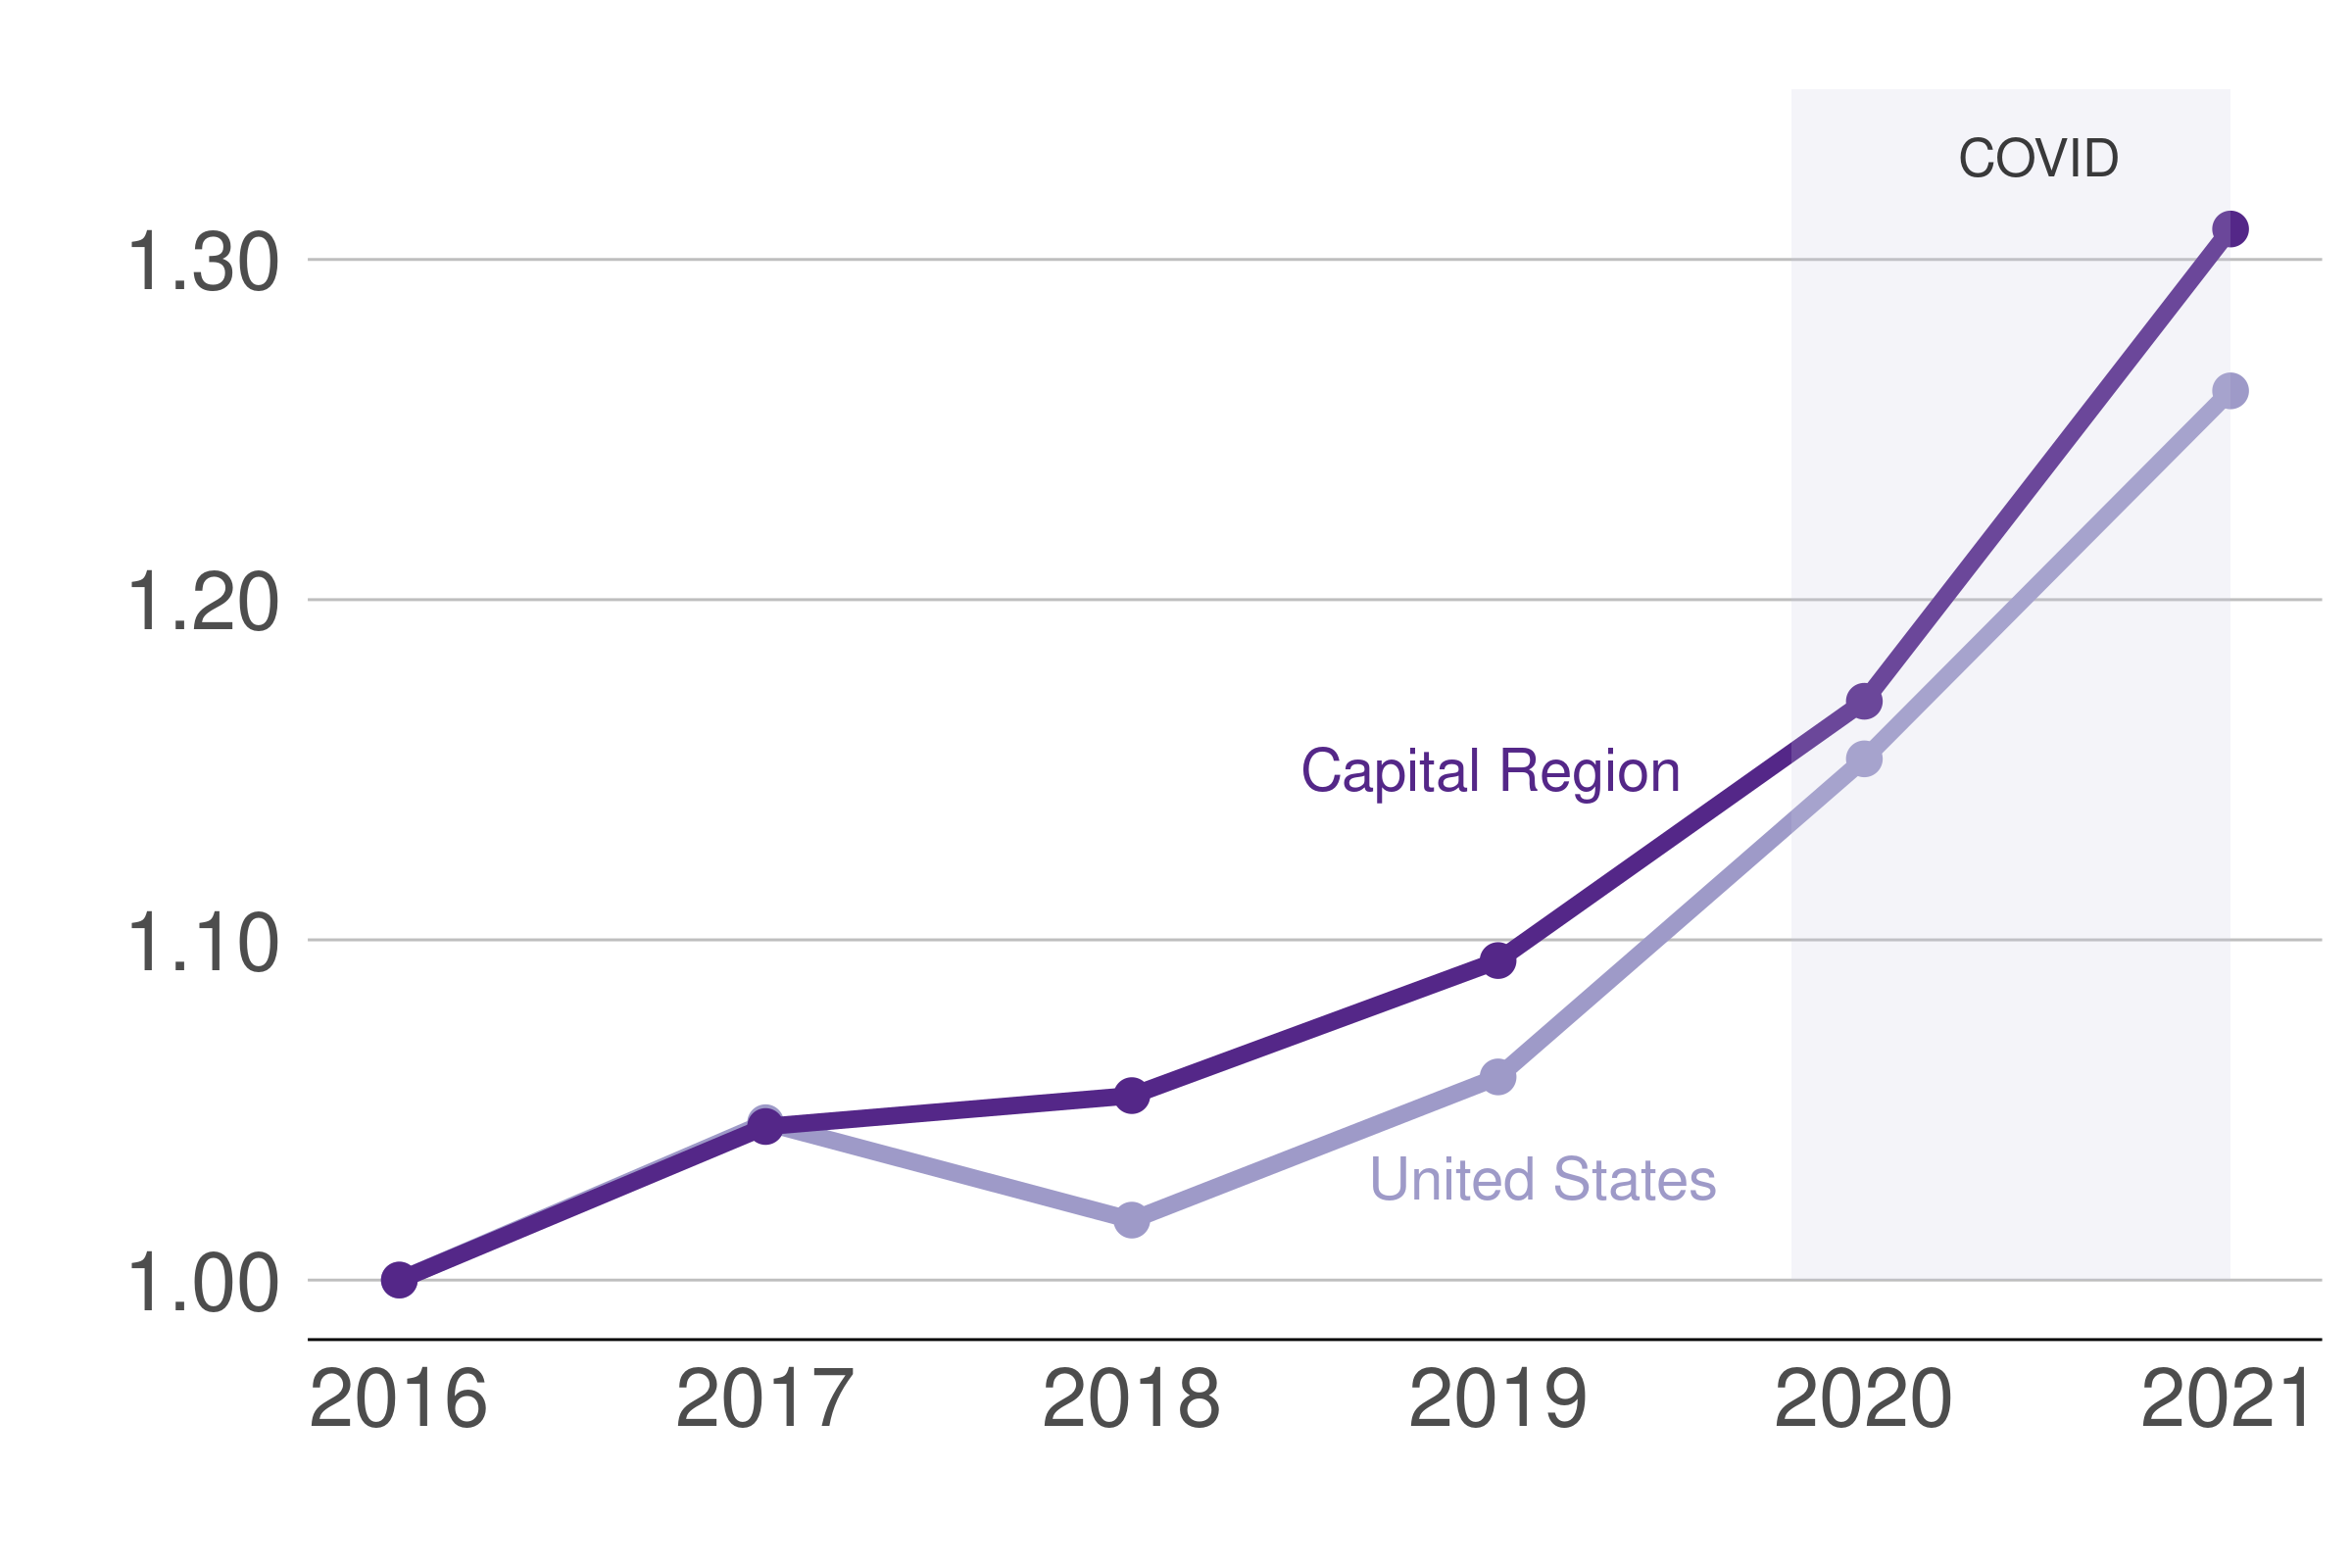
Source: Capital Region: HMDA, 2016-2021. Entire US HMDA data, 2016-2021. Dietrich et al, 2018; Liu et al, 2021.
These changes were large and present in most of the rest of the country as well. Figure 2.4 illustrates that the Capital Region experience mimicked nationwide trends in total loan volume.
Figure 2.5: The pandemic triggered a refinancing boom
Number of mortgage refinances, 2007-2021
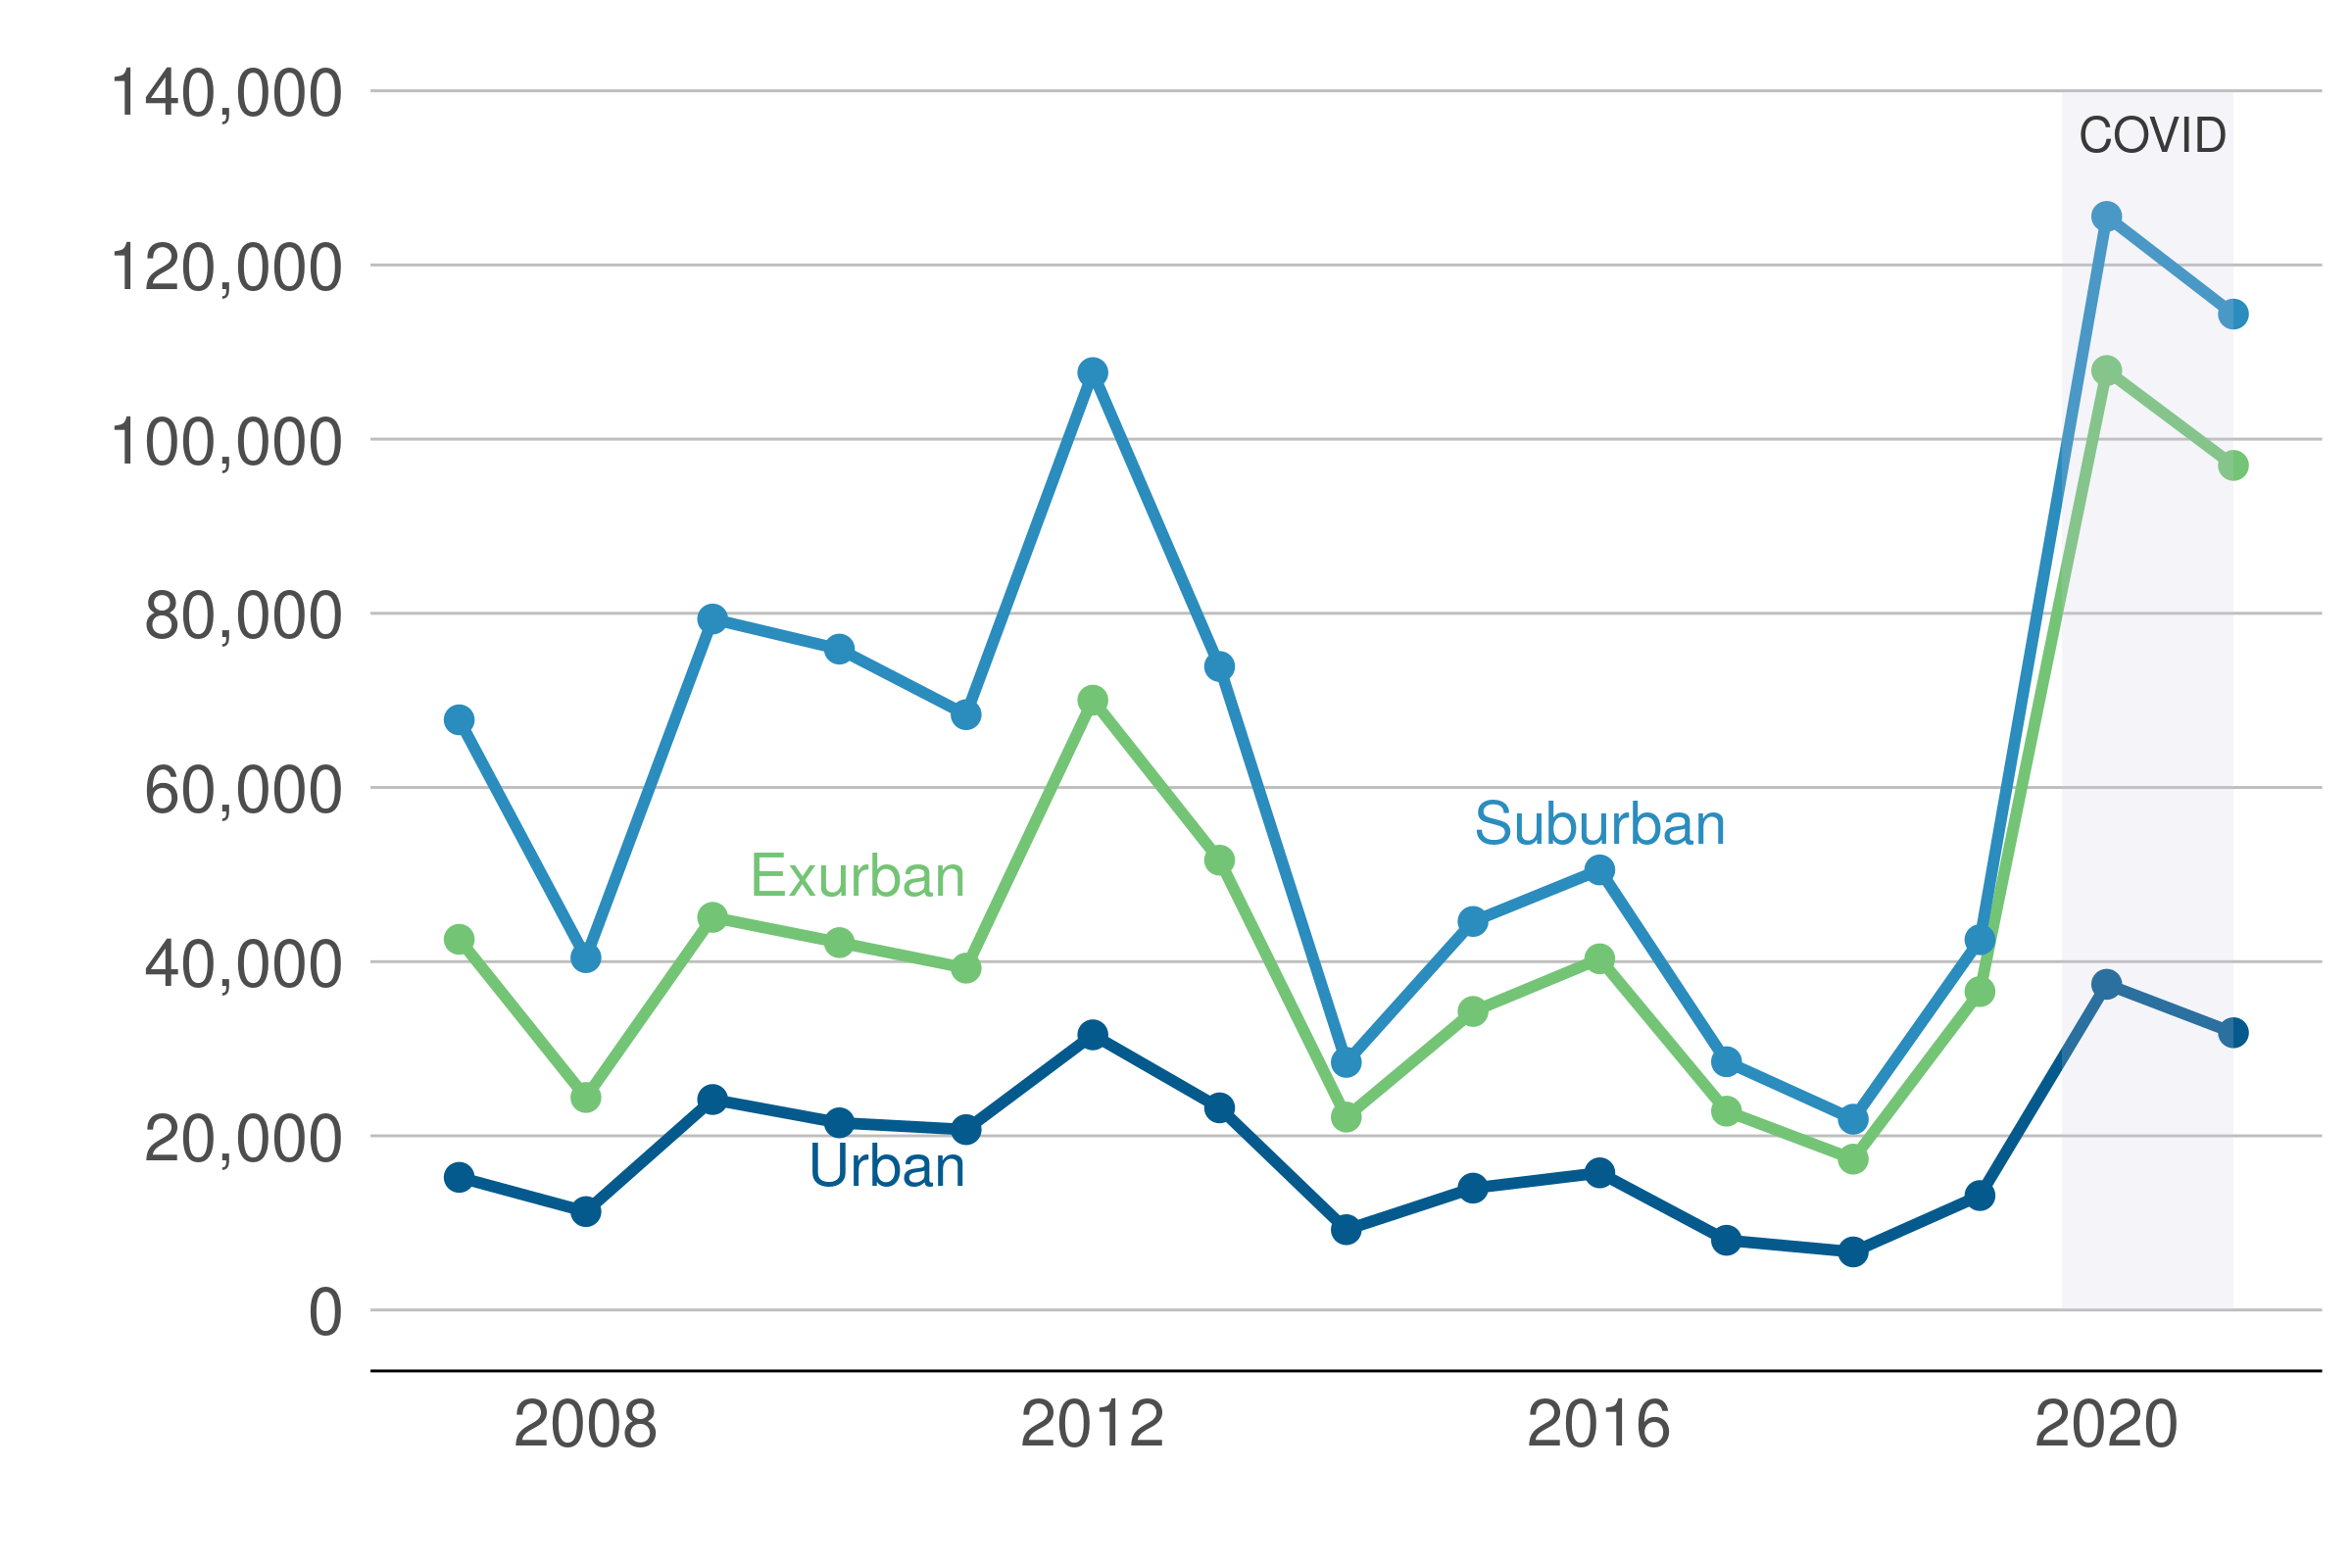
Source: HMDA, 2007-2021. Notes: Includes both straight refinance and cash-out refinance loans.
Mortgage refinancing is significantly more volatile than home purchase loans. In the early months of the pandemic, the rapid drop in interest rates triggered a refinancing boom. This boom persisted into 2021. In urban, suburban, and exurban jurisdictions, refinancing tripled. Volumes in 2020 reached levels well above the post-global financial crisis peak of 2012. While they subsided ever so slightly in 2021, they remained at historical highs, confirming the general tendency toward significant growth in the mortgage market during the first two years of the pandemic.