Chapter 1: What were Capital Region homebuying patterns between the Great Recession and the pandemic?
Just before the pandemic hit, the value and number of mortgage loans had roughly returned to their values from before the Great Recession.
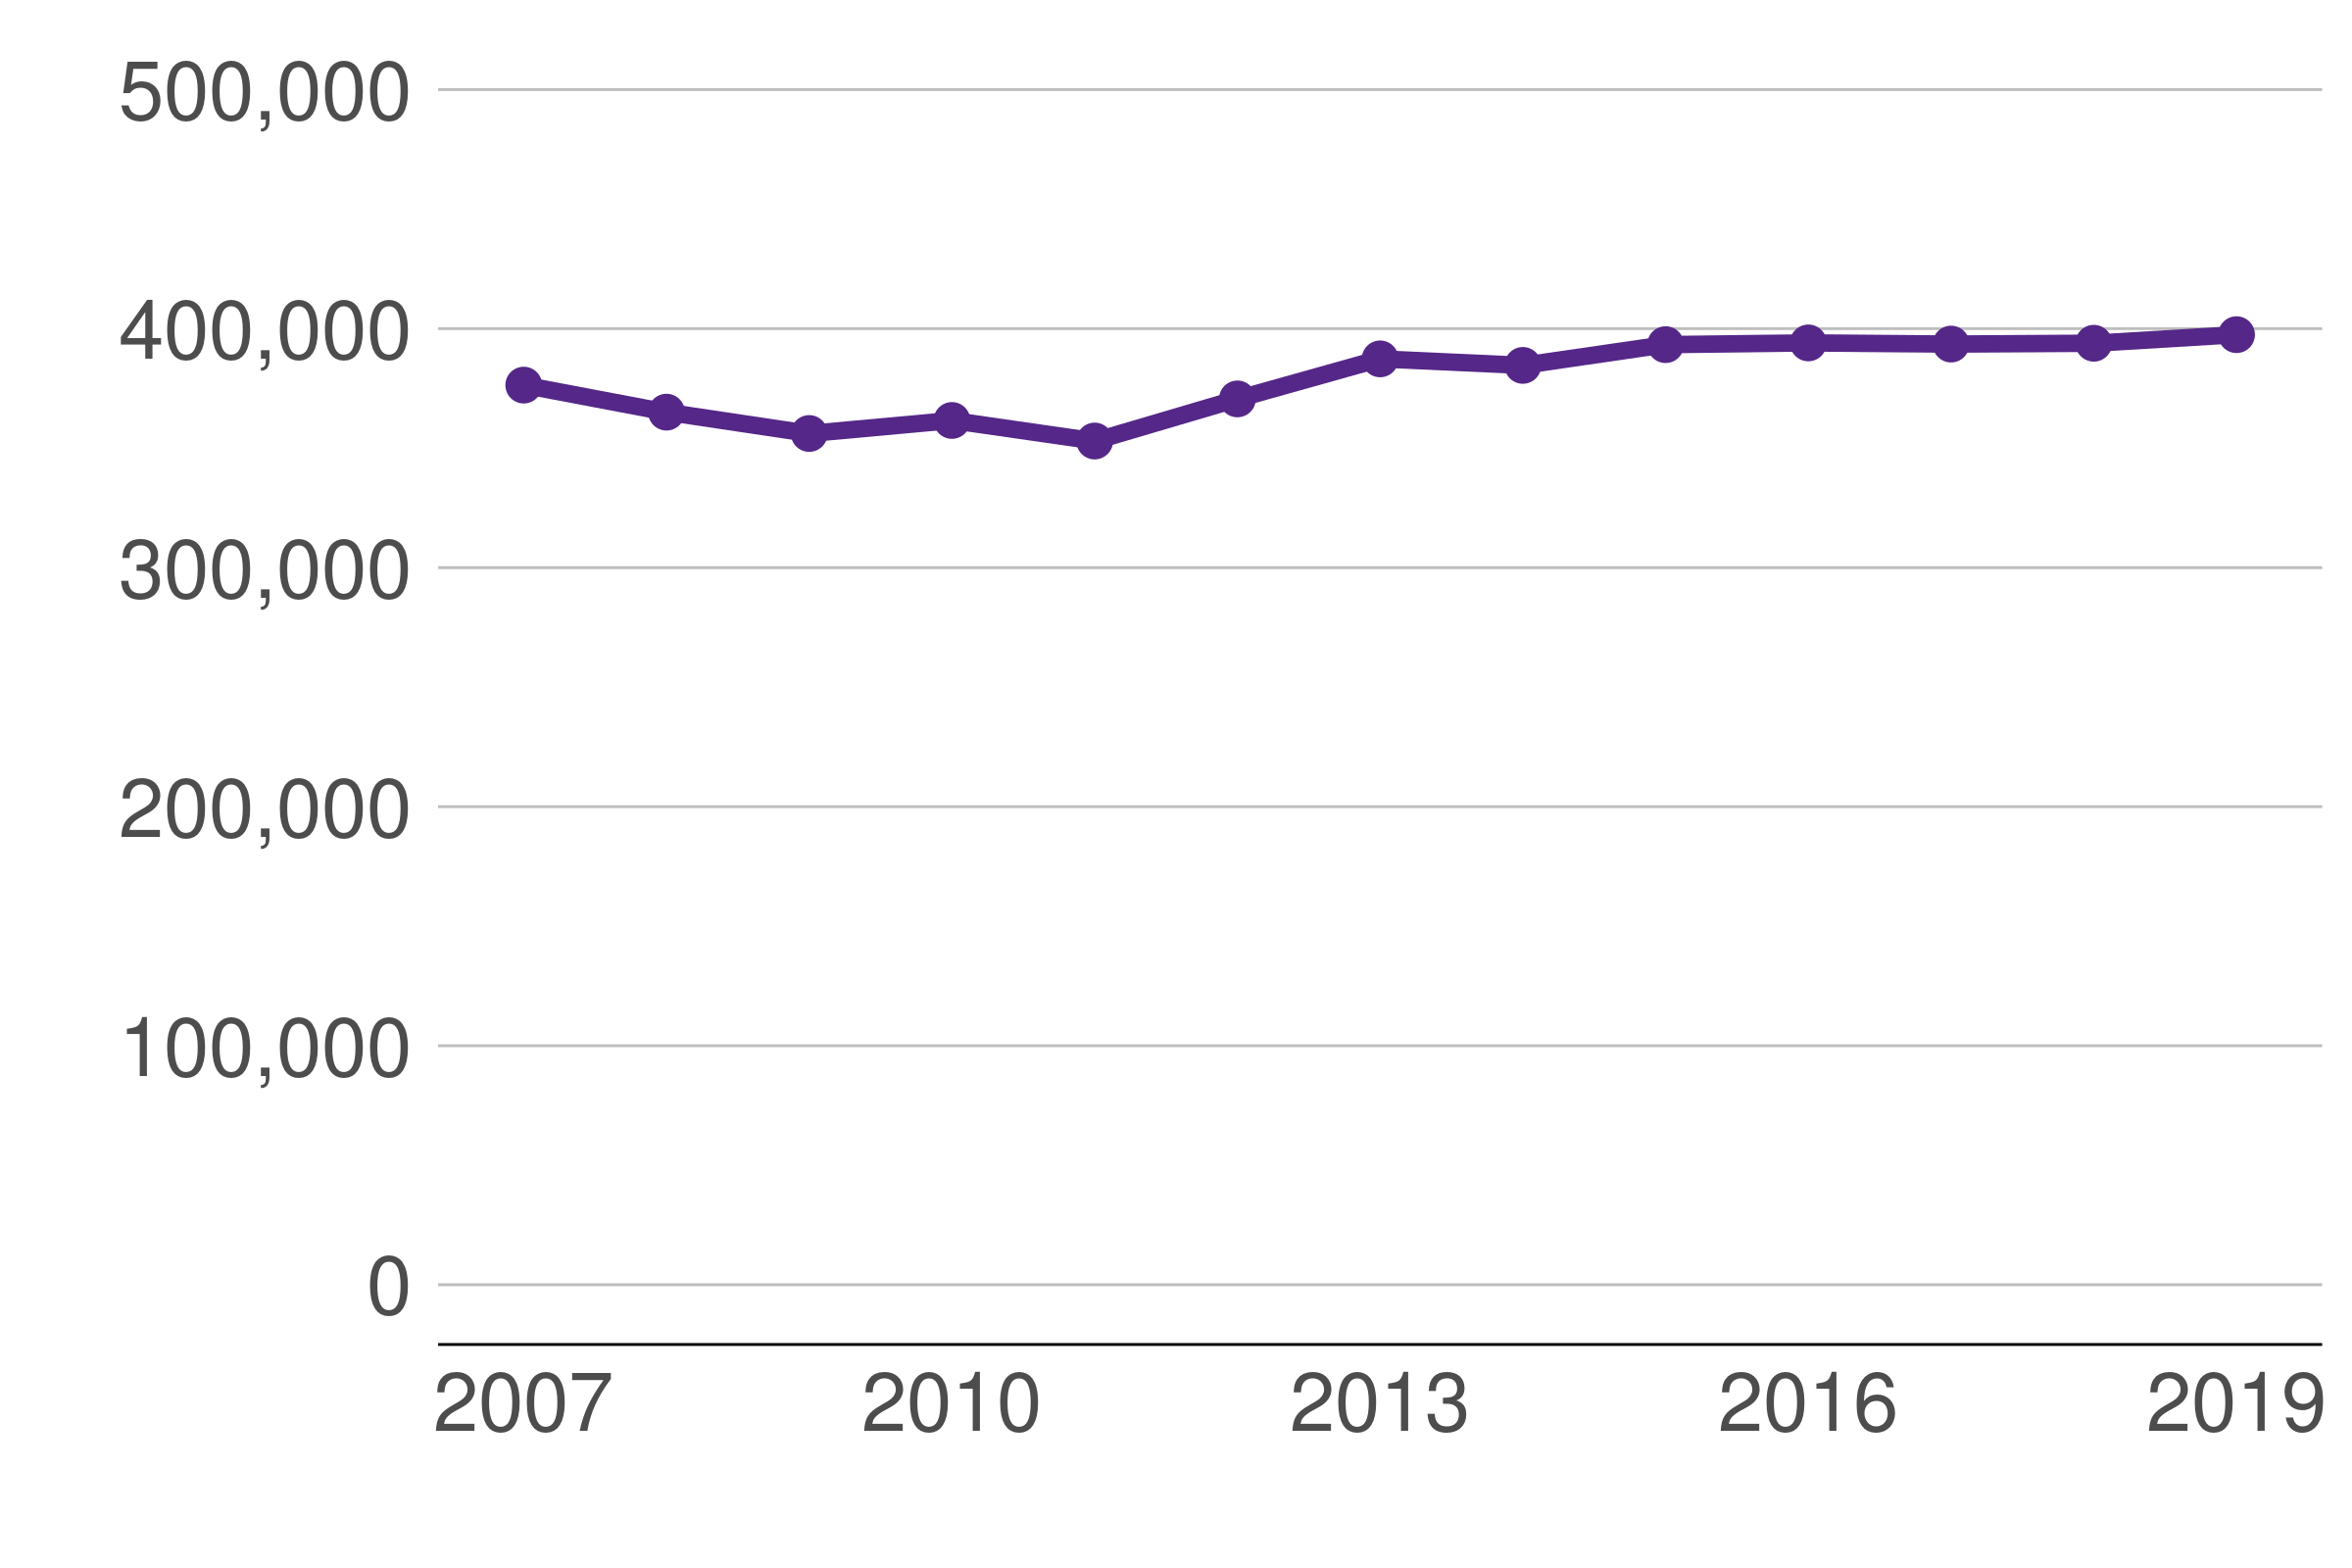
Figure 1.1: Median loan amounts are higher than before the Great Recession
Median loan value for home purchase loans, 2007-2019, 2021 dollars
Source: HMDA, 2007 to 2019.
The median value of mortgage loans declined from just under $380,000 in 2007 to about $350,000 in 2011 (all figures in 2021 dollars). This decline occurred as housing prices fell during the Great Recession. Since 2011, as the region’s housing market has recovered, median loan values have increased steadily, reaching nearly $400,000 in 2019.
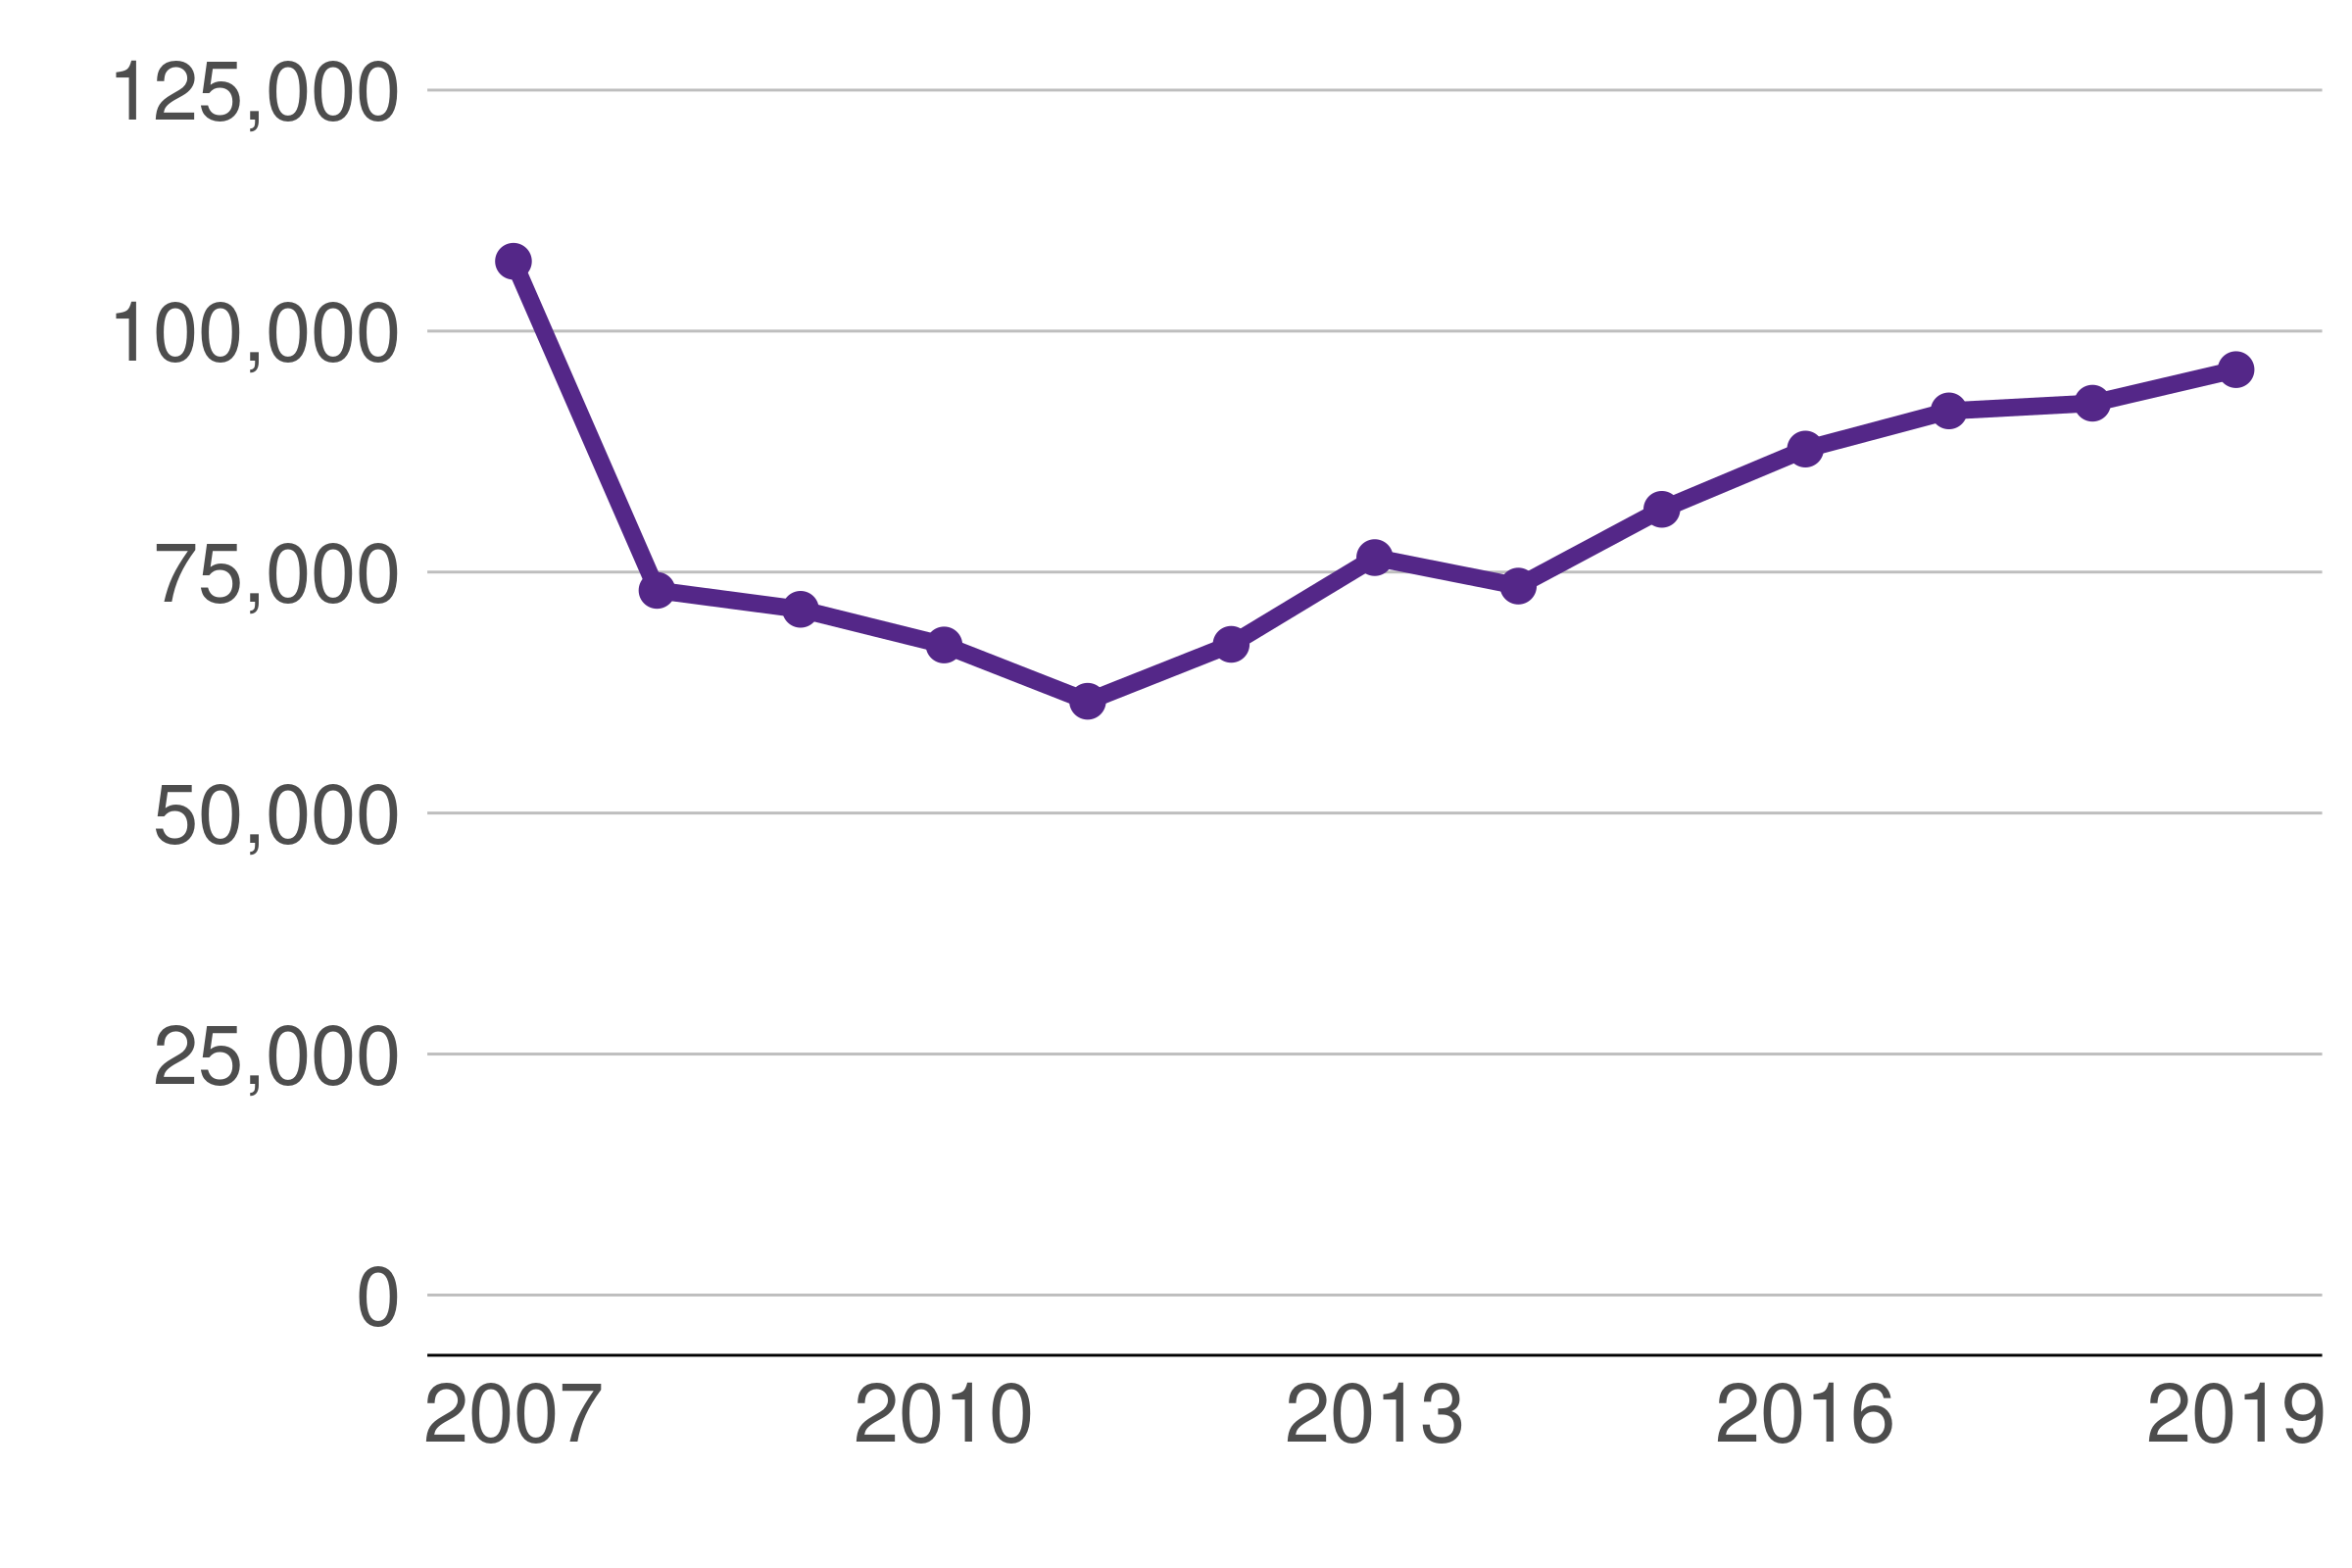
Figure 1.2: Loan volume dropped sharply in Great Recession and recovered slowly
Total home purchase loans originated, 2007-2019
Source: HMDA, 2007 to 2019.
The Great Recession had an even larger impact on the number of mortgage loans originated. In 2007, lenders issued just under 110,000 mortgages, which fell to about 62,000 in 2011, or a decline of more than 40%. By 2019, loan volume had still not reached the 2007 peak, with 90,000 loans originated. The drop in loan volume likely reflects both policy changes and housing market conditions. Federal regulators increased the stringency of mortgage underwriting. These new standards made it more difficult for economically marginal borrowers to qualify for a loan. Additionally, unless confronted with immediate financial distress, existing homeowners are less likely to sell their homes when housing prices decline. Price drops encourage existing owners to stay in place longer—known as an increase in the “stickiness” of home sales.
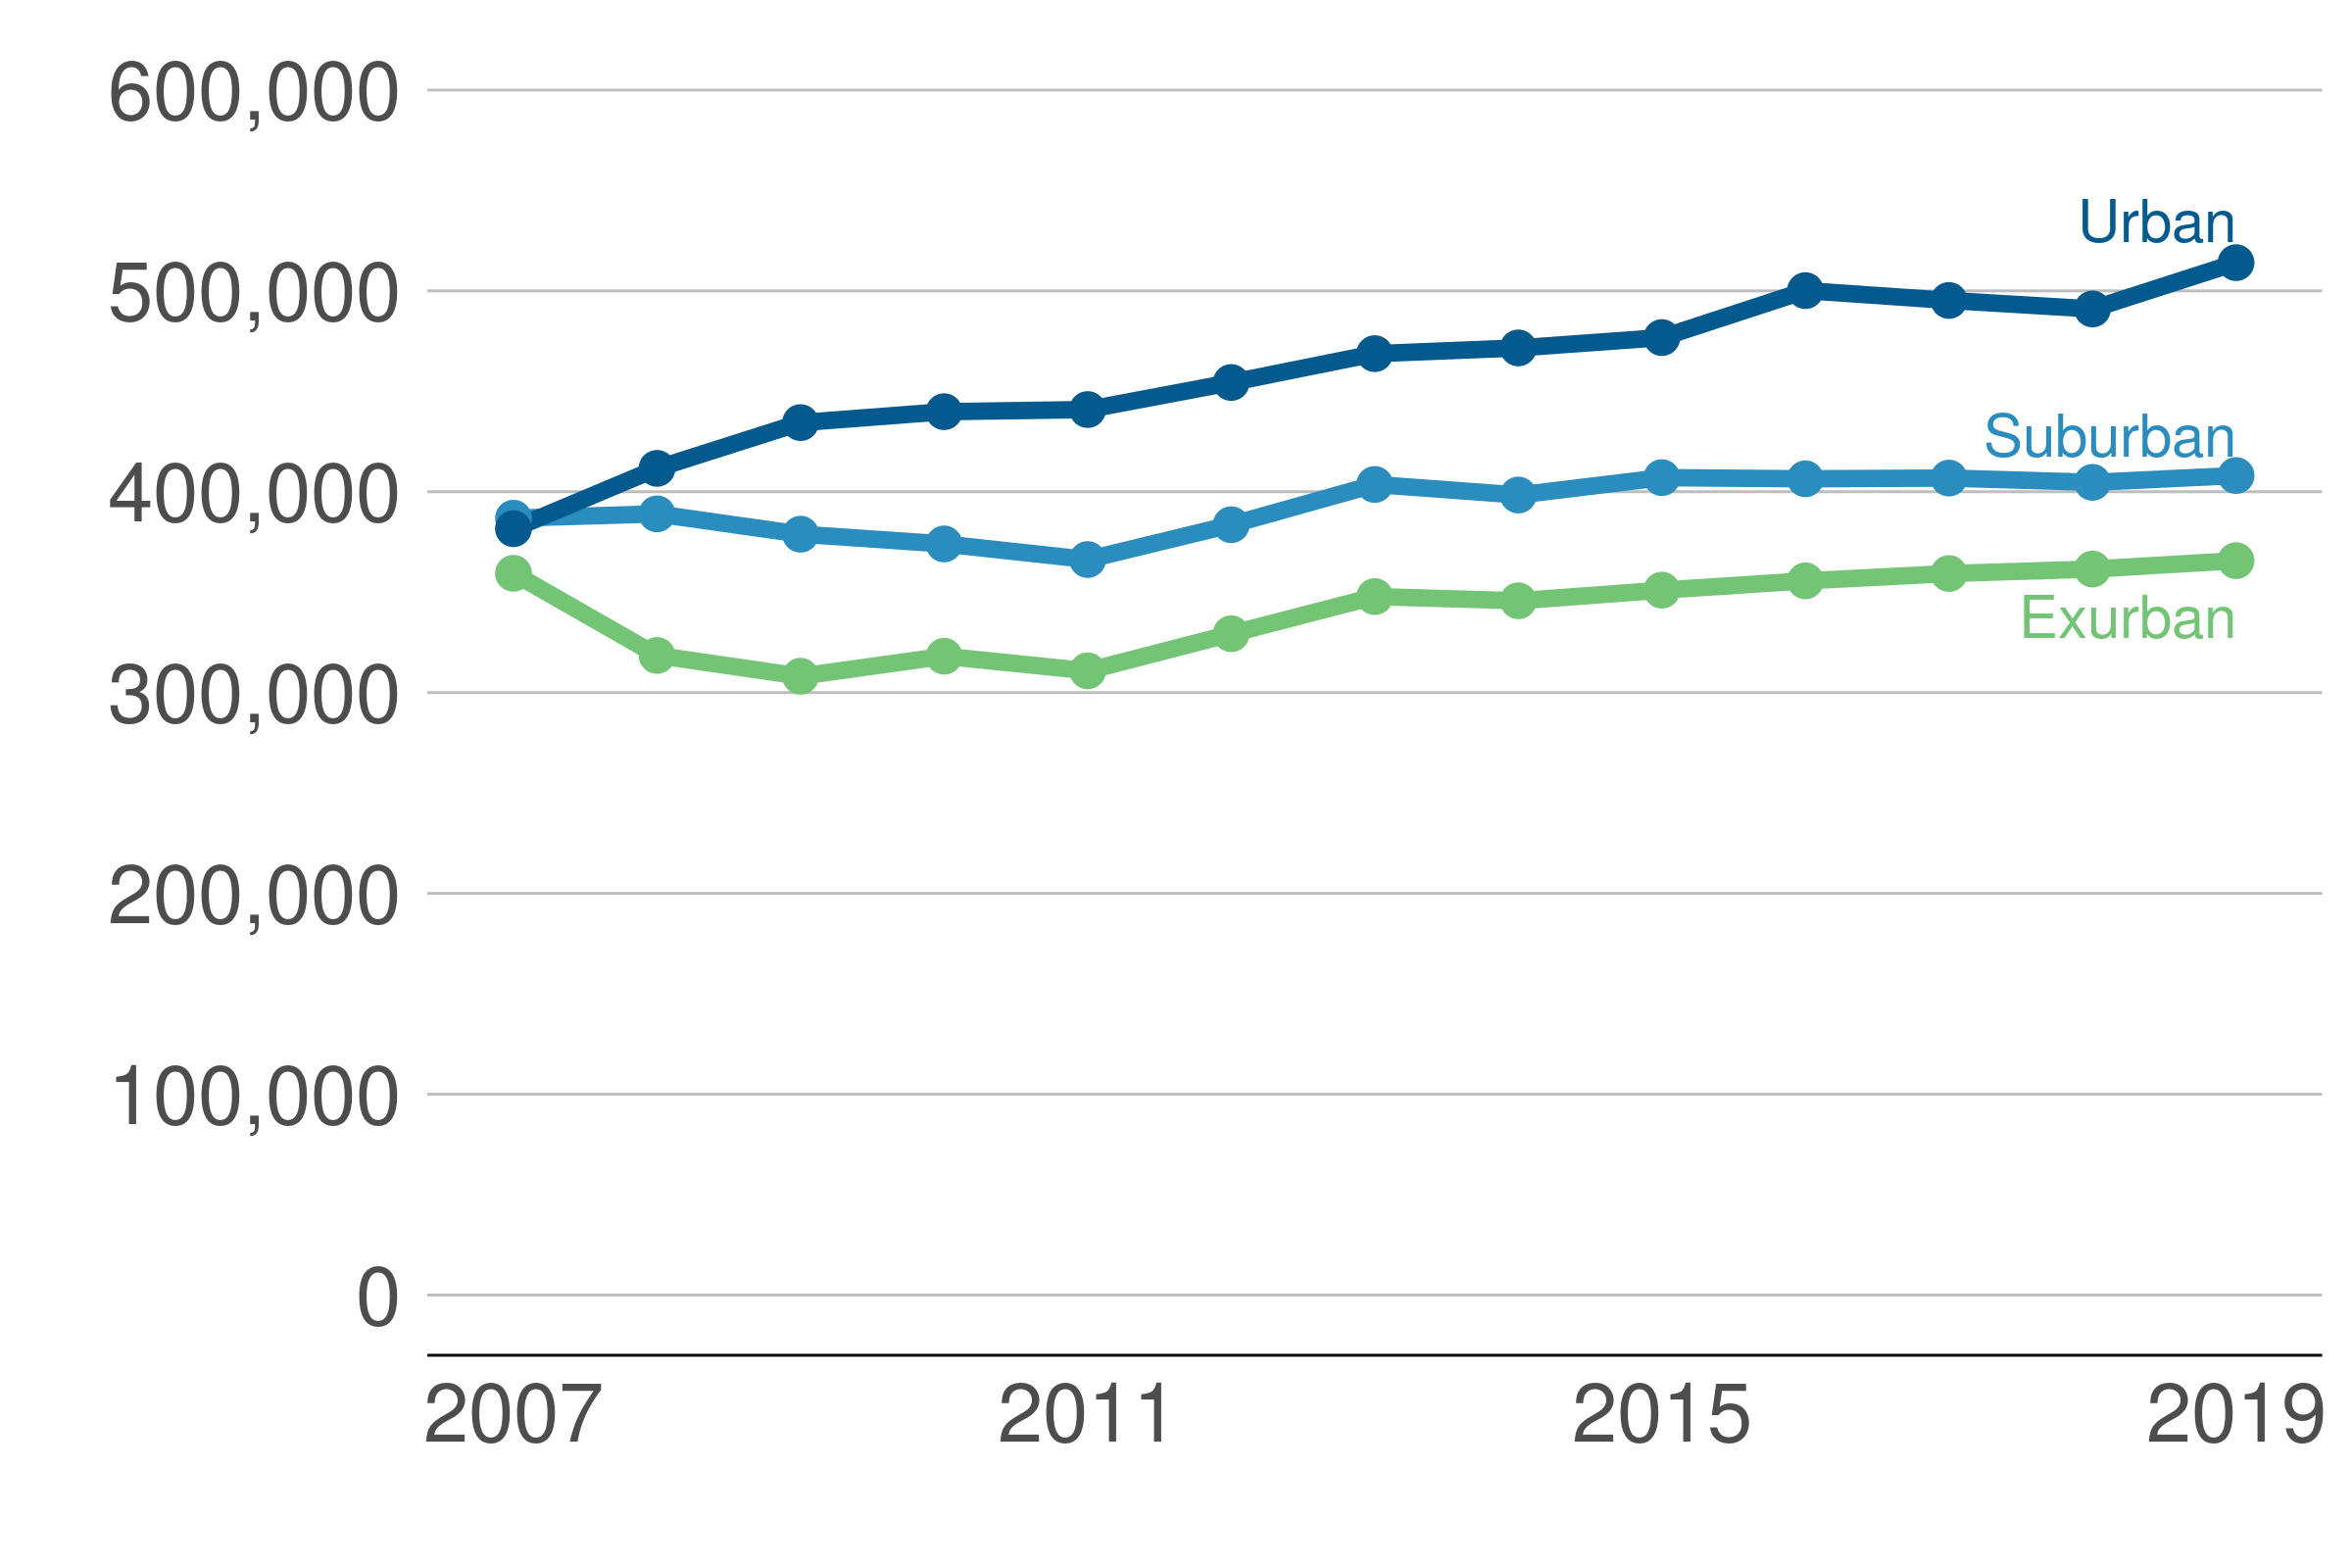
Figure 1.3: Mortgage value increased in all parts of the Capital Region
Median loan value for home purchase loans by urban, suburban, and exurban status, 2007-2019, 2021 dollars
Source: HMDA, 2007 to 2019.
Median loan values in urban, suburban, and exurban areas show somewhat different patterns following the Great Recession. In urban jurisdictions, loan values fell very little after 2007, and in the following decade have increased compared to suburban and exurban jurisdictions. Urban loan values rose from just under $400,000 in 2007 to over $500,000 in 2019. Median loan values in suburban and exurban jurisdictions dropped slightly during the Great Recession, and have subsequently recovered. By 2019, median loan values slightly exceeded pre-recession levels.
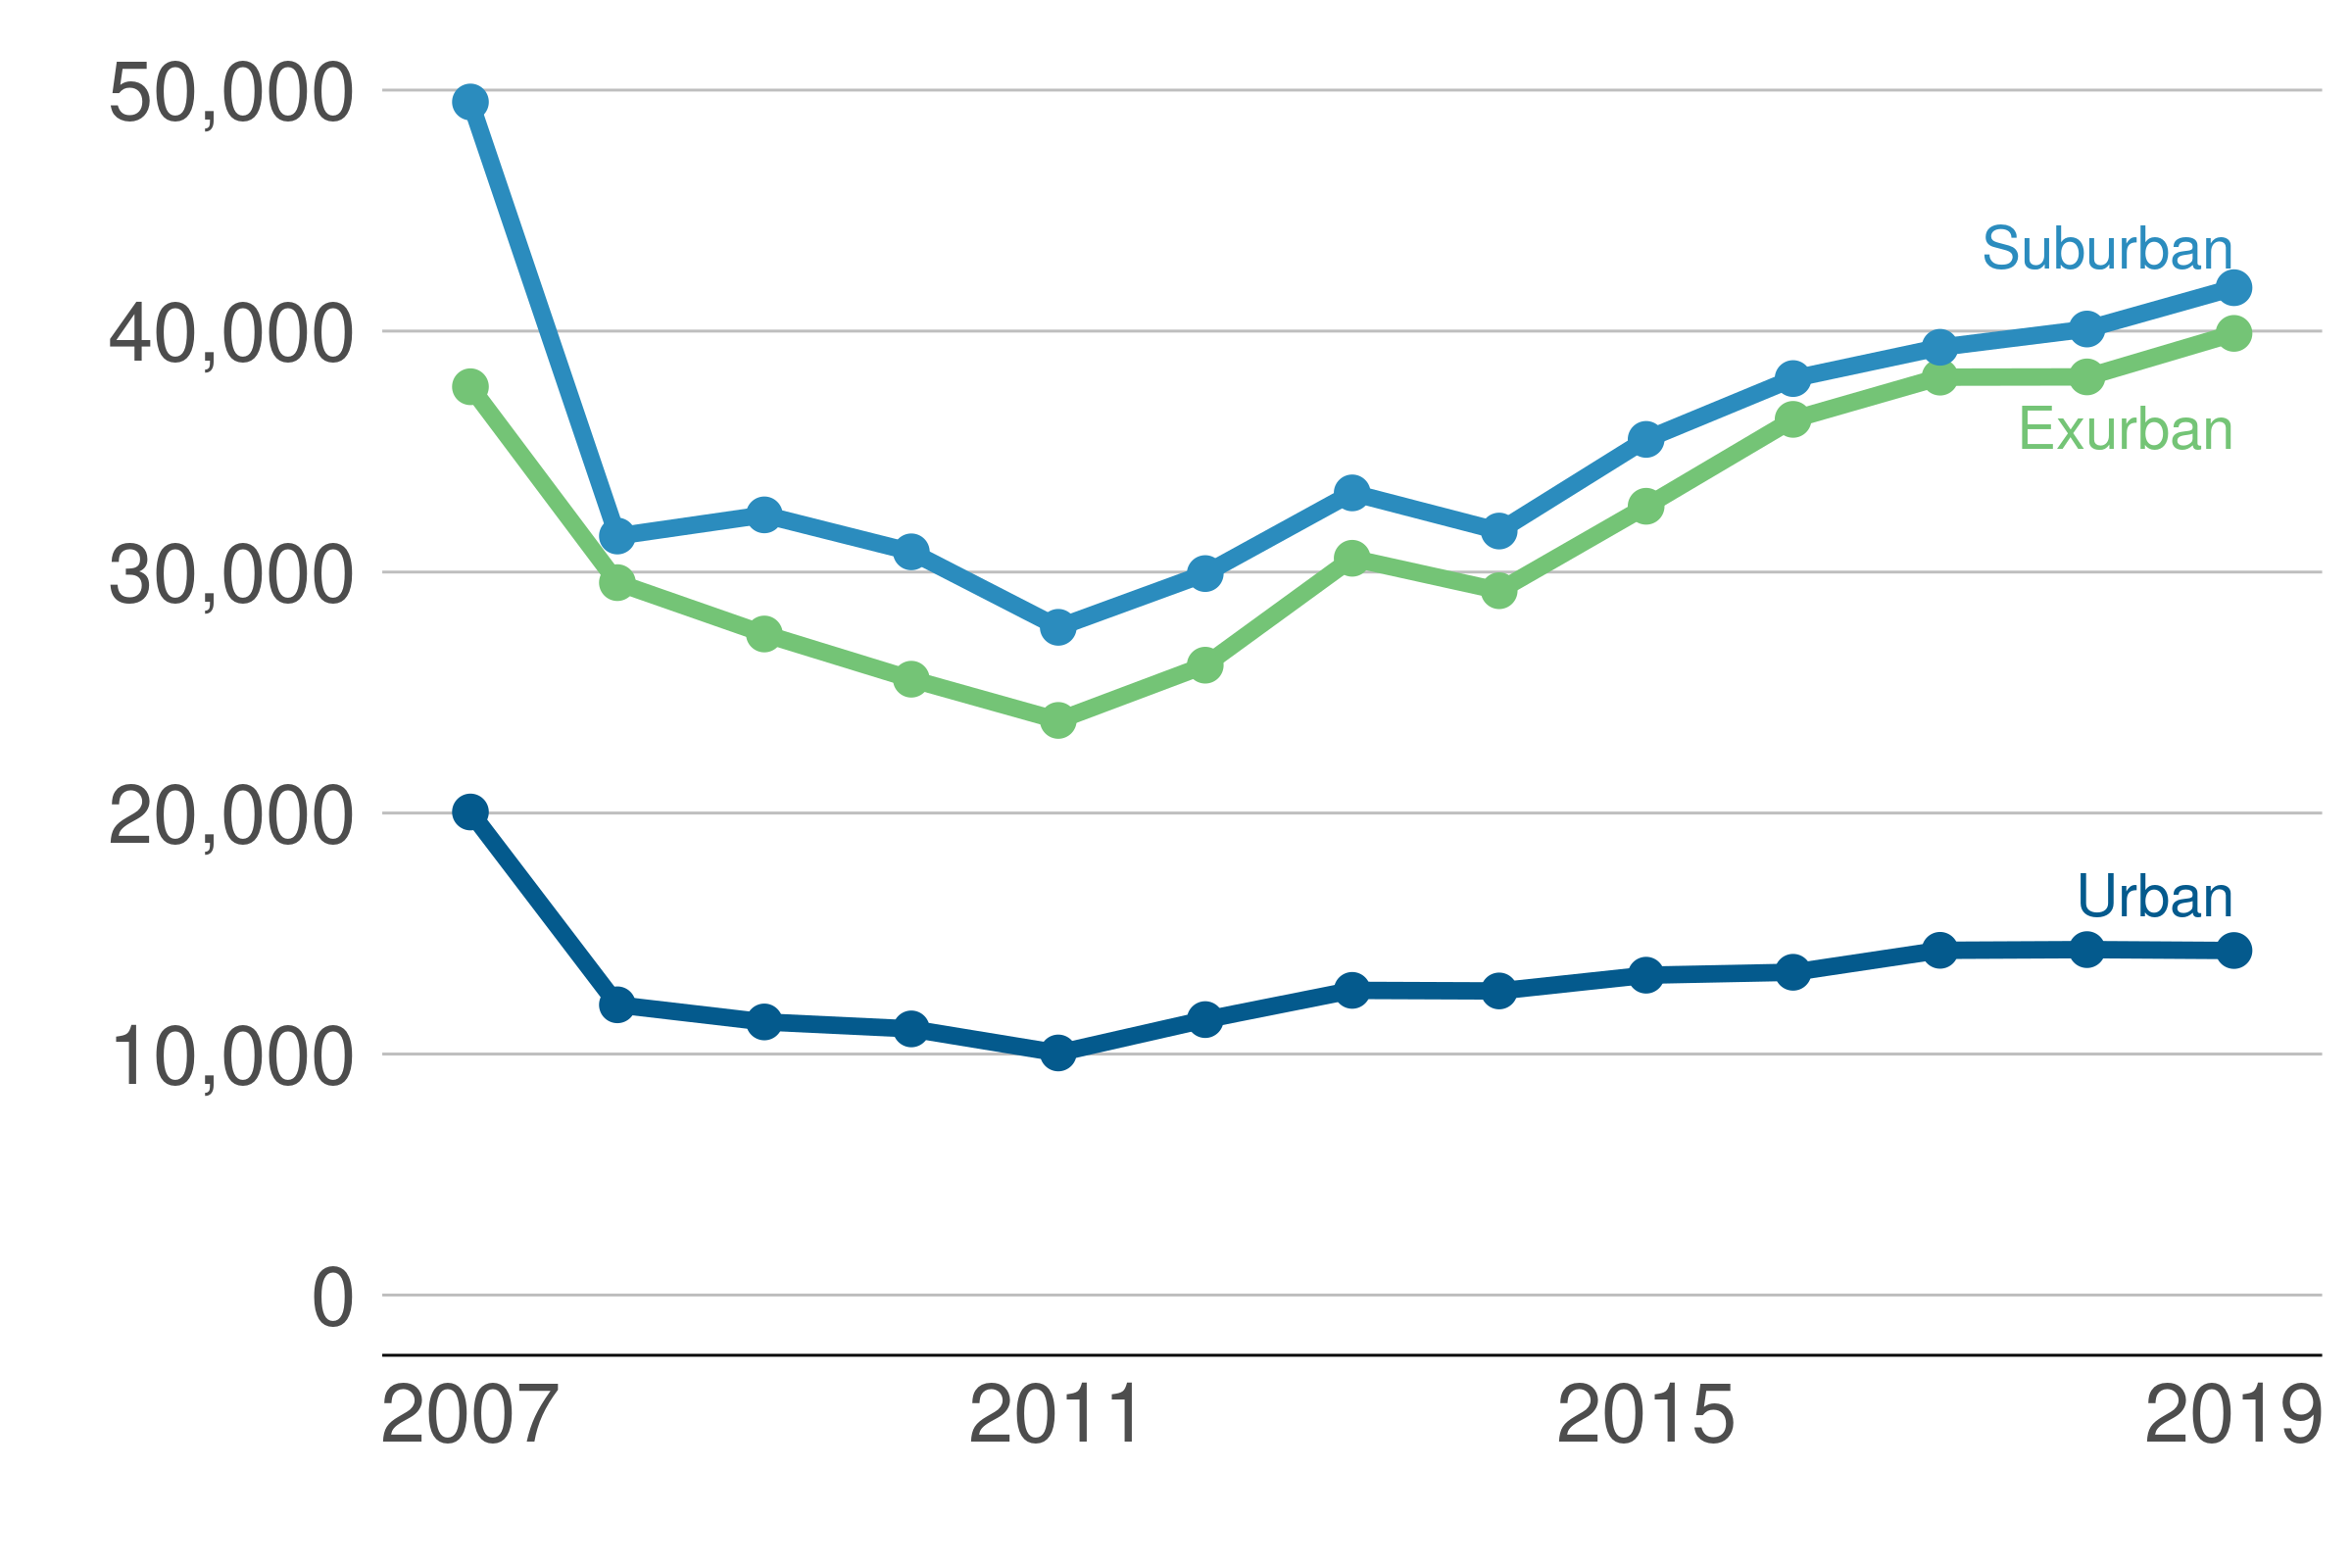
Figure 1.4: Loan volumes varied more in suburban and exurban jurisdictions
Home purchase loan volume by urban, suburban, and exurban status, 2007-2019
Source: HMDA, 2007 to 2019.
During the Great Recession (2007-2009), loan volume fell in all parts of the Capital Region. The pattern of recovery, however, varied across urban, suburban, and exurban jurisdictions. In urban jurisdictions, fewer mortgages were originated in each year between 2008 and 2019 than in 2007. The urban core accounts for roughly 17 percent of the population in the Capital Region and has a larger share of renter households than the rest of the region. Annual loan volume in urban areas fell from about 20,000 in 2007 to 10,000 in 2011, a decline of 50 percent. By 2019, urban loan volume had only recovered to about 14,000. Suburban and exurban jurisdictions—each of which constitute a larger share of the regional mortgage market than urban jurisdictions—saw somewhat smaller percentage declines during the Great Recession. Loan volume in suburban jurisdictions declined by 44 percent, while loan volume in exurban jurisdictions declined by 37 percent. By 2019, only exurban jurisdictions had a higher loan volume than before the Great Recession, while suburban loan volume had recovered to about 85% of its 2007 level.
Figure 1.5: Mortgage lending in Capital Region was similar to rest of US during previous decade
Loan volume for Capital Region and United States relative to 2007 volume, 2007-2019
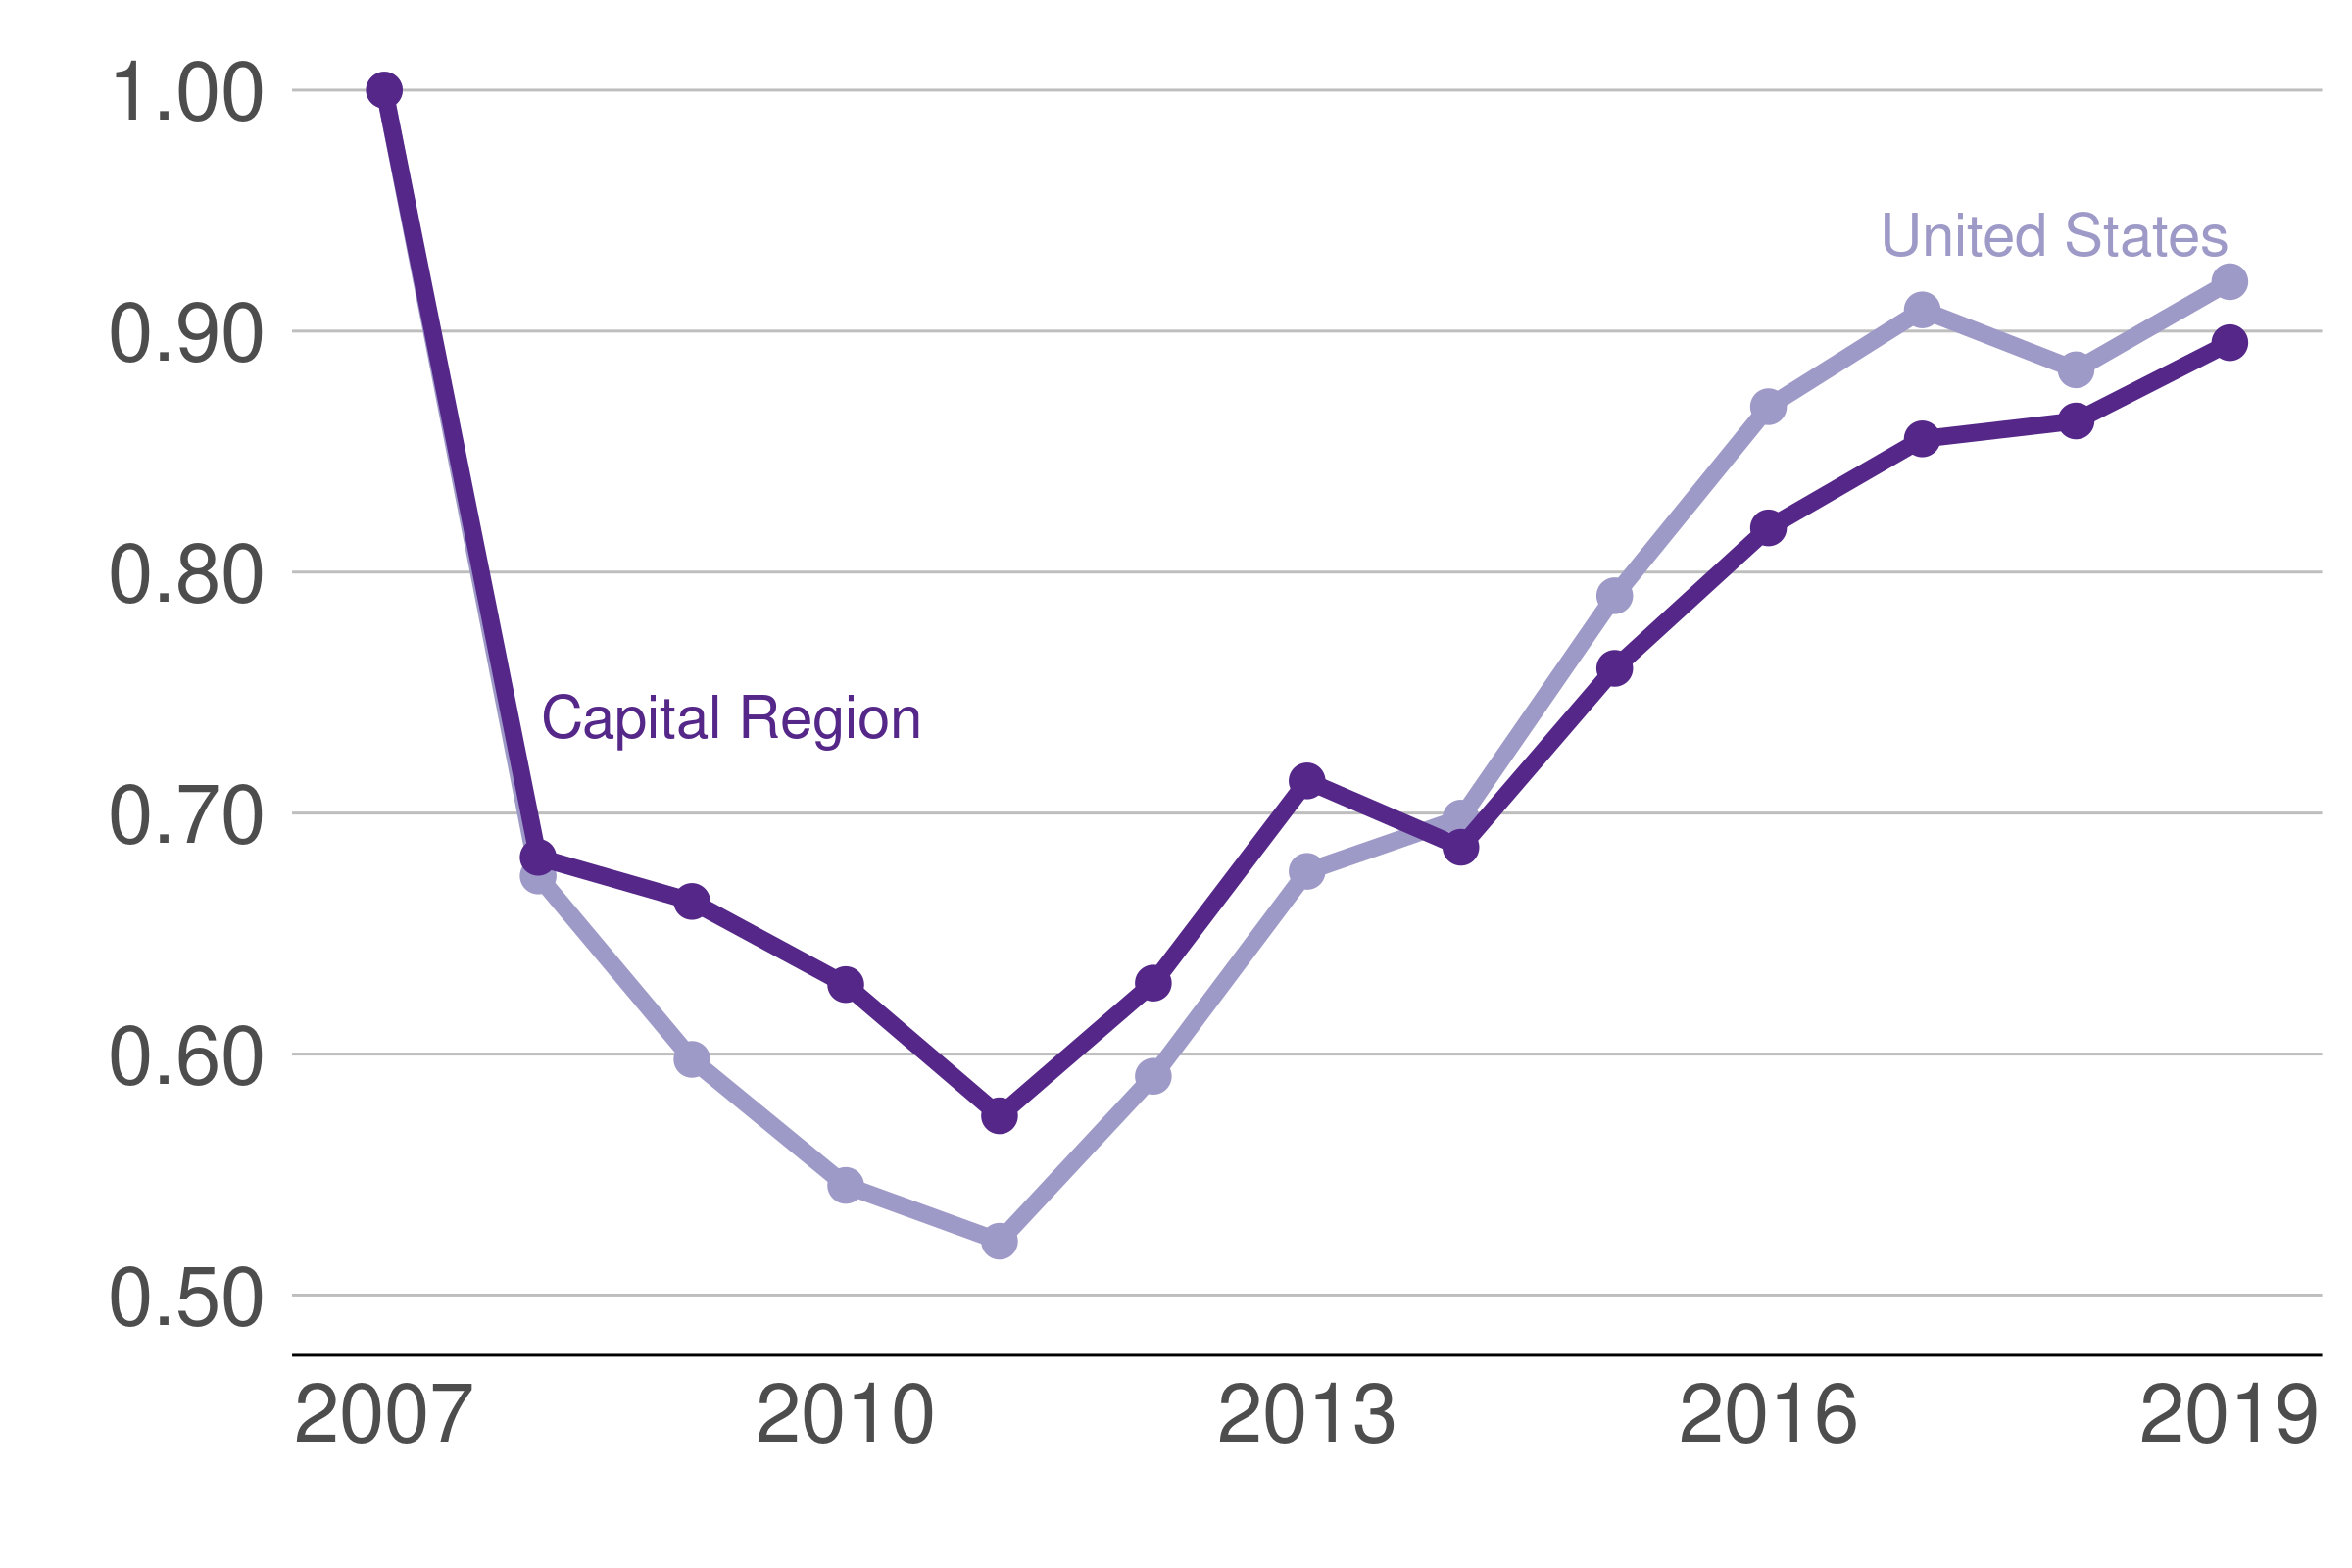
Source: Capital Region: HMDA, 2007-2019. Entire US HMDA data, 2007-2019. Dietrich et al, 2018; Liu et al, 2021.
Trends in Capital Region mortgage volumes during the 2007-2019 period broadly echo lending trends in other parts of the U.S. All parts of the country saw sharp declines in mortgage activity from 2007 to 2011, with gradual recovery following the declines. The Capital Region saw a slightly smaller peak-to-trough drop in loans than the rest of the country. And as of 2019, the Capital Region had recovered somewhat less ground. Recovery in lending volume reflects both rising home prices and historically low interest rates.