Chapter 3: Were there pandemic-era changes in the income of recent homebuyers by distance to the Central Business District?
In this chapter, we examine whether the pandemic caused large changes in where homebuyers of different income levels buy homes across the Capital Region. To begin, we examine the relationship between recent homebuyer income and location before the pandemic. Figure 3.1 shows that the income of recent homebuyers varies widely in neighborhoods close to the Central Business District. Within 10 miles of the Central Business District—a distance that encompasses almost four in 10 Capital Region neighborhoods—in some neighborhoods the average recent homebuyer earns more than $300,000, while in other neighborhoods the corresponding number is less than $100,000.
Figure 3.1: Neighborhoods close to the Central Business District attract high and low income borrowers
Neighborhood distance in miles to the White House versus average income of recent homebuyers, 2018 and 2019, 2021 dollars
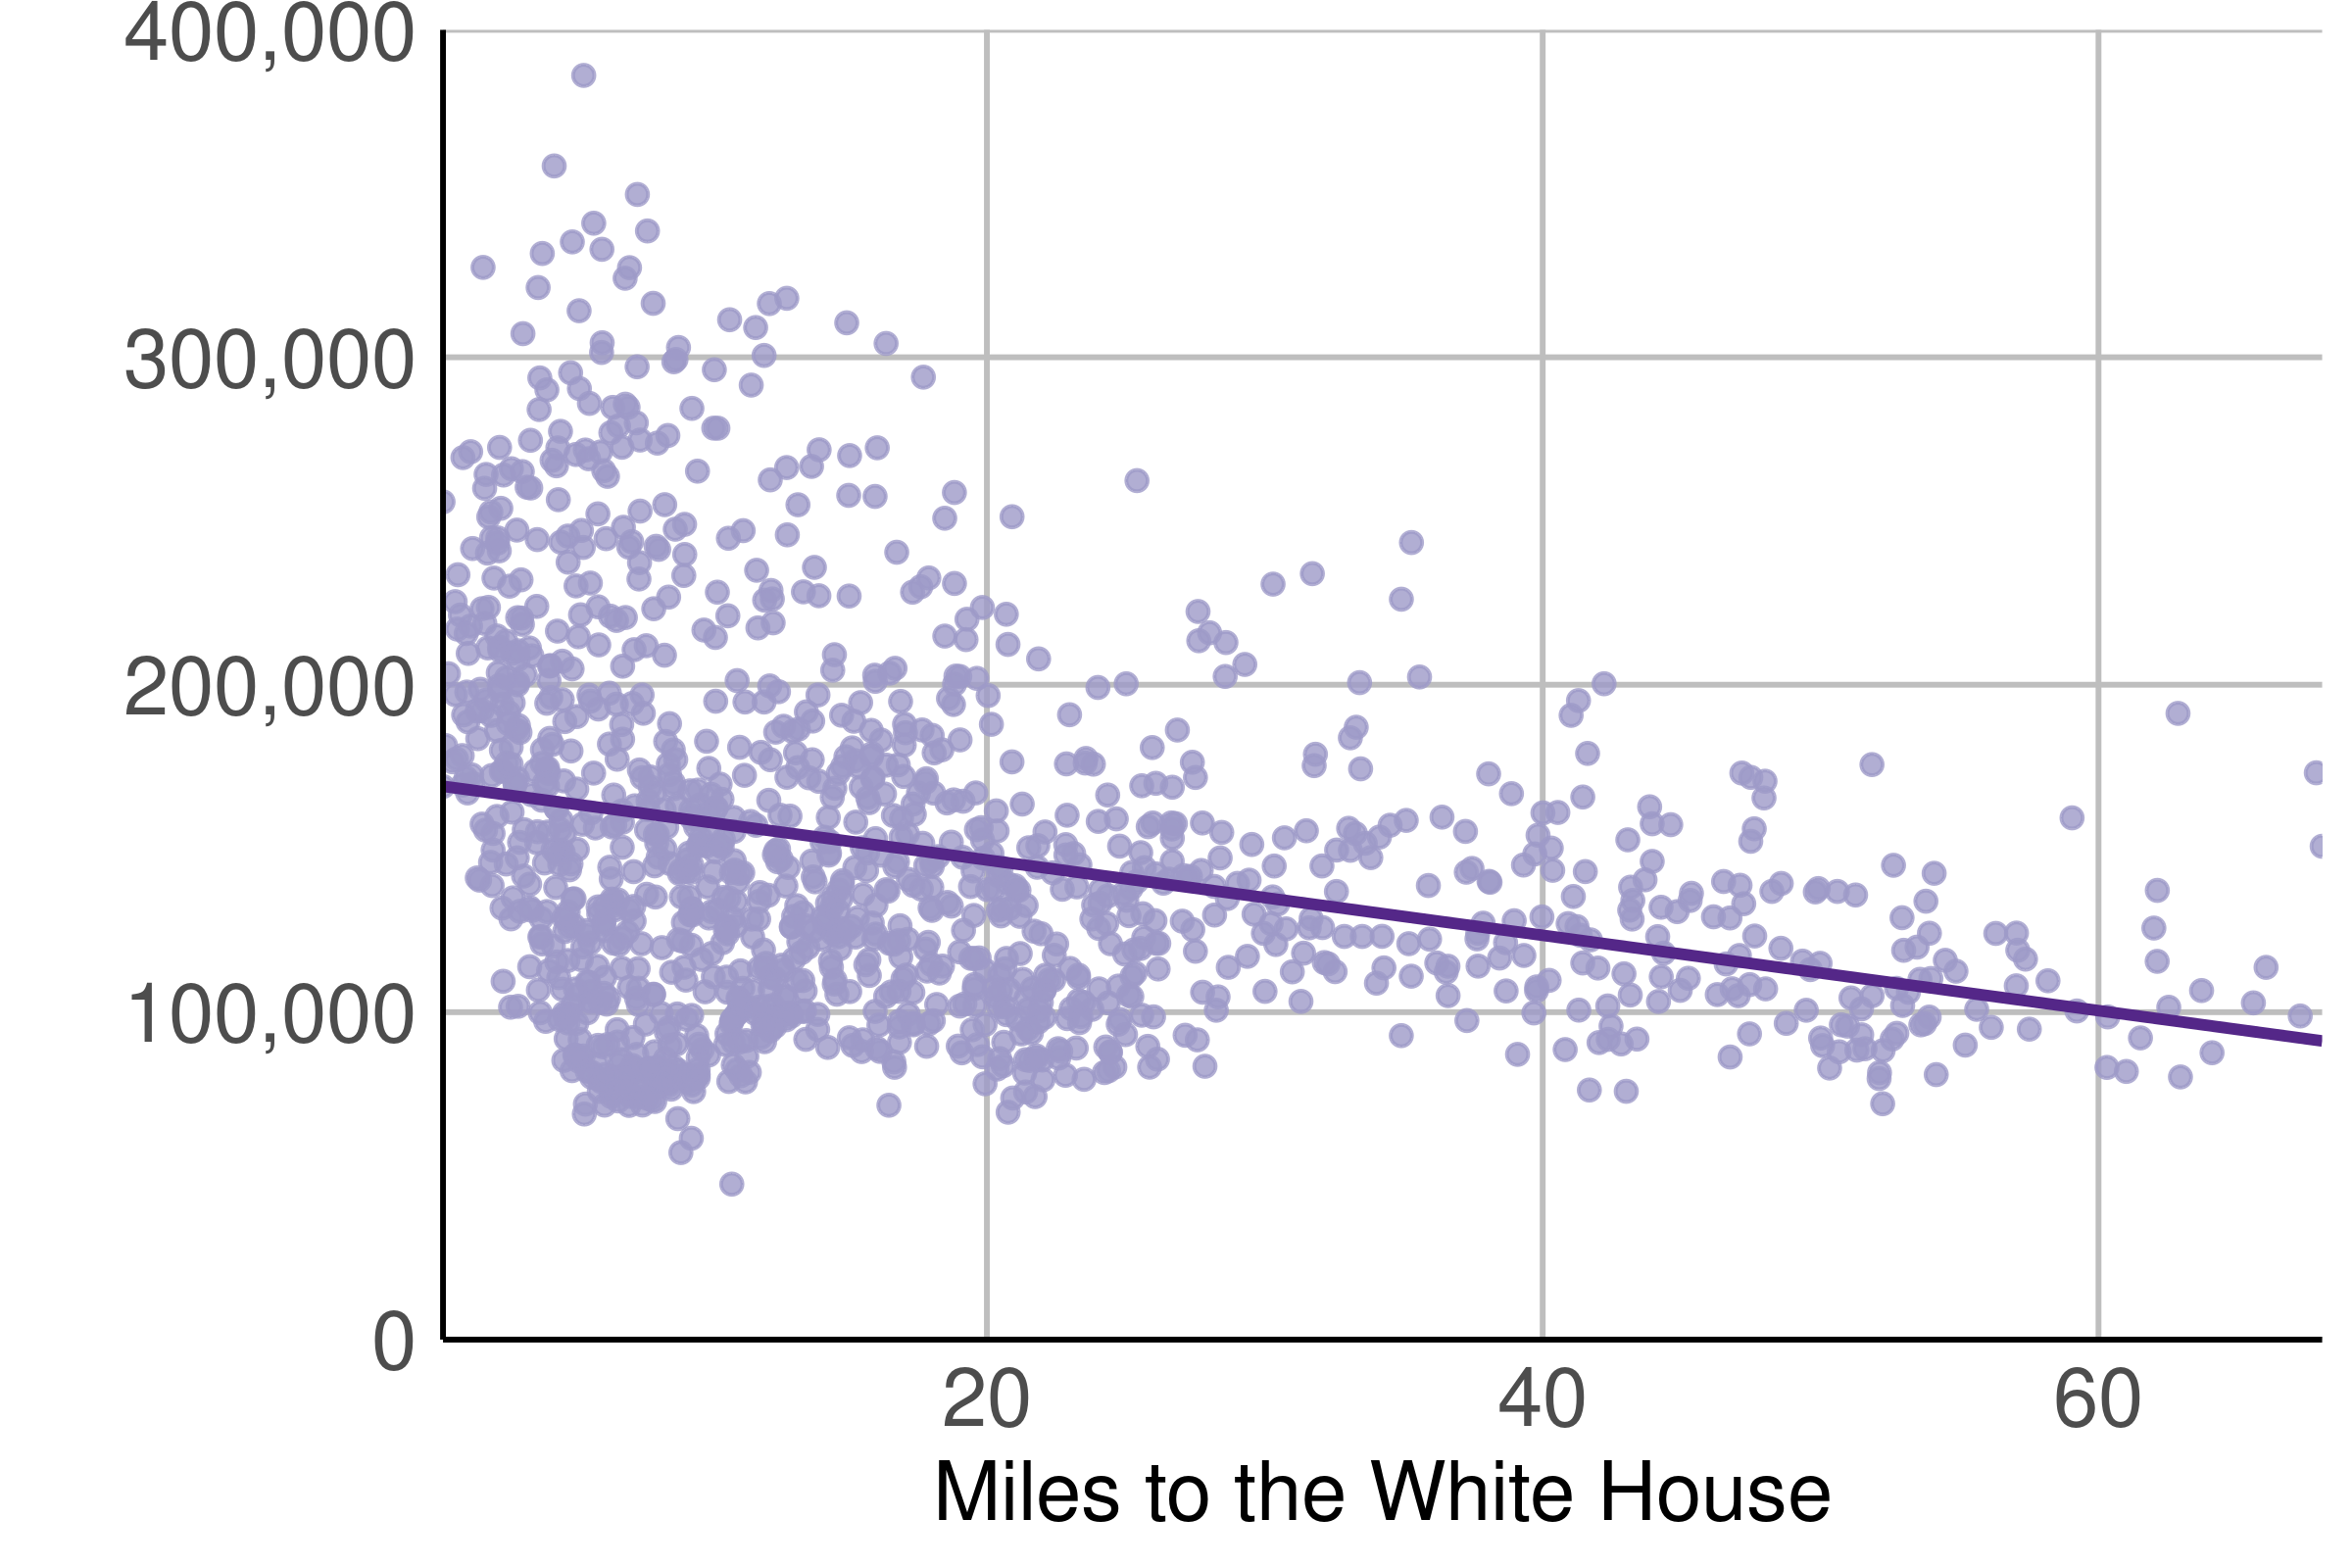
Source: HMDA, 2018 and 2019. Notes: We keep incomes between the 2nd and 99th percentile of the income distribution. We report average neighborhood income in 2018 and 2019 for all recent homebuyers.
Farther from the Central Business District, the average income of recent homebuyers declines. Neighborhoods within ten miles of the Central Business District include both the wealthiest and poorest neighborhoods, as measured by recent homebuyer income. In contrast, no neighborhood more than forty miles from the Central Business District has an average recent homebuyer income greater than about $200,000.
Figure 3.2: Slight income increase for recent homebuyers farther from the White House
Neighborhood distance in miles from the White House versus percentage change in average recent homebuyer income, 2018 & 2019 versus 2020 & 2021
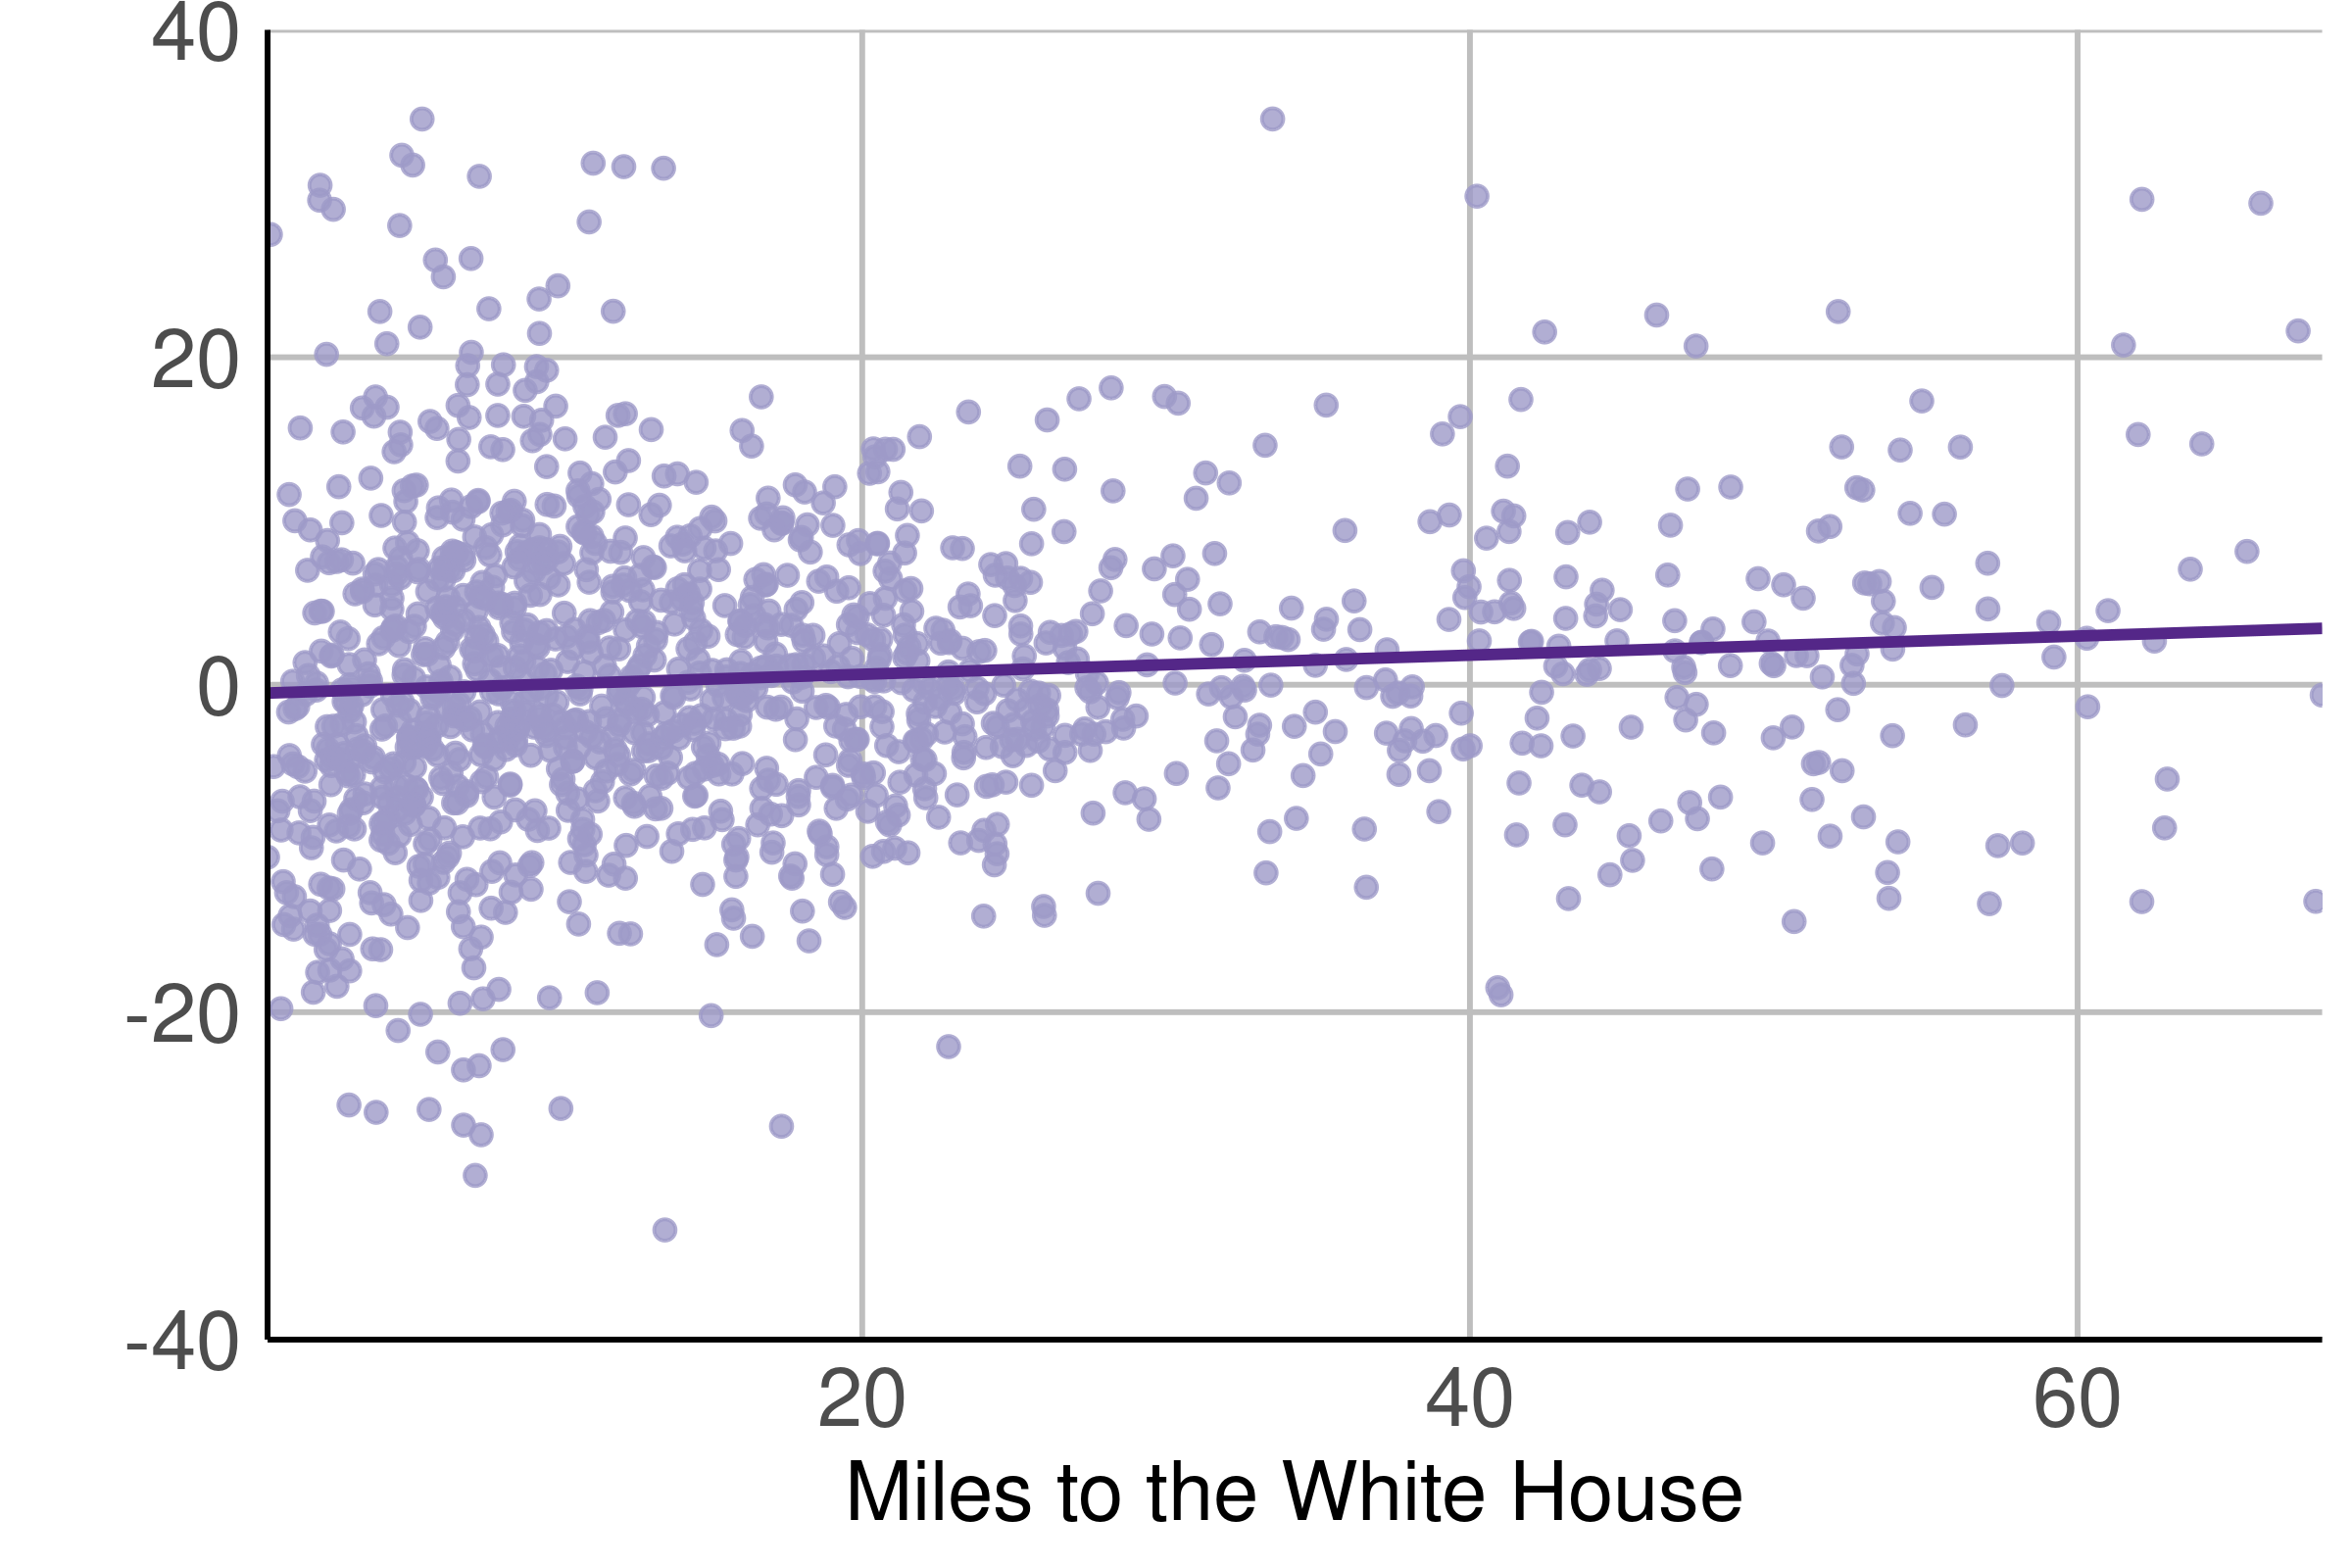
Source: HMDA, 2018-2021. Notes: We calculate neighborhood change as average income of included borrowers for 2020 and 2021 minus average income of included borrowers for 2018 and 2019, divided by average income of included borrowers for 2018 and 2019. We report changes between -35 and 35 percent. This is 97% of all neighborhoods with borrower incomes between the 2nd and 99th percentile.
Media reports have suggested that the pandemic and the rise of remote work caused affluent white-collar professionals to leave dense urban areas for the far suburbs and beyond. Do we see this pattern with Capital Region homebuyers? In Figure 3.2, we show the percentage change in average homebuyer income from the pre-pandemic era (2018 and 2019) to the pandemic era (2020 and 2021) versus the neighborhood’s distance to the Central Business District. Neighborhoods farther from the Central Business District had slightly larger increases in the average income of recent homebuyers than neighborhoods closer to the Central Business District.
Thus, on average, wealthier homebuyers chose to live farther from the Central Business District. However, this gradual change is not an exodus, and there are some signs that the move out of the city is already waning. As was true before the pandemic, neighborhoods with the very largest changes in recent homebuyer income were closest to the Central Business District.