State of the Capital Region 2026

The Capital Region and the Trump Shock
This report is a collaborative effort from researchers at the American Enterprise Institute, Georgetown University, and George Washington University. We are particularly grateful to the Trachtenberg School of Public Policy and Public Administration and the George Washington Institute for Public Policy for their support. We very much appreciate the support of George Washington student Amelia Mansfield, who expertly prepared our graphics and contributed to the analysis. We are grateful to Bright MLS for granting access to data that allow us to describe the regional housing market.
Introduction
The Trump Administration changes to the federal labor force, starting in January 2025, have caused major upheaval in the Capital Region workforce and economy. These changes have three big components: Trump ordered federal workers to return to in-person office attendance, the Administration has cut more than 20,000 federal jobs as of December 2025, and the Administration continues a push to move some existing jobs outside of the Capital Region.
The economic impact is palpable. In 2025, real GDP in the District of Columbia grew by less than a half percent, or about a quarter of the national rate of growth. Even more alarmingly, from the third to the fourth quarter of 2025, GDP in the District declined by more than 8 percent (annualized), as shown in Figure I.1. This large decline is likely due to a combination of labor force changes and the 2025 federal government shutdown. To put this decline in context, it is about the same as the rate of decline in US GDP during the first year of the Great Depression.
Figure I.1: Percentage Change in Gross Domestic Product from Prior Quarter, annualized
Percentage Change in Gross Domestic Product from Prior Quarter, annualized
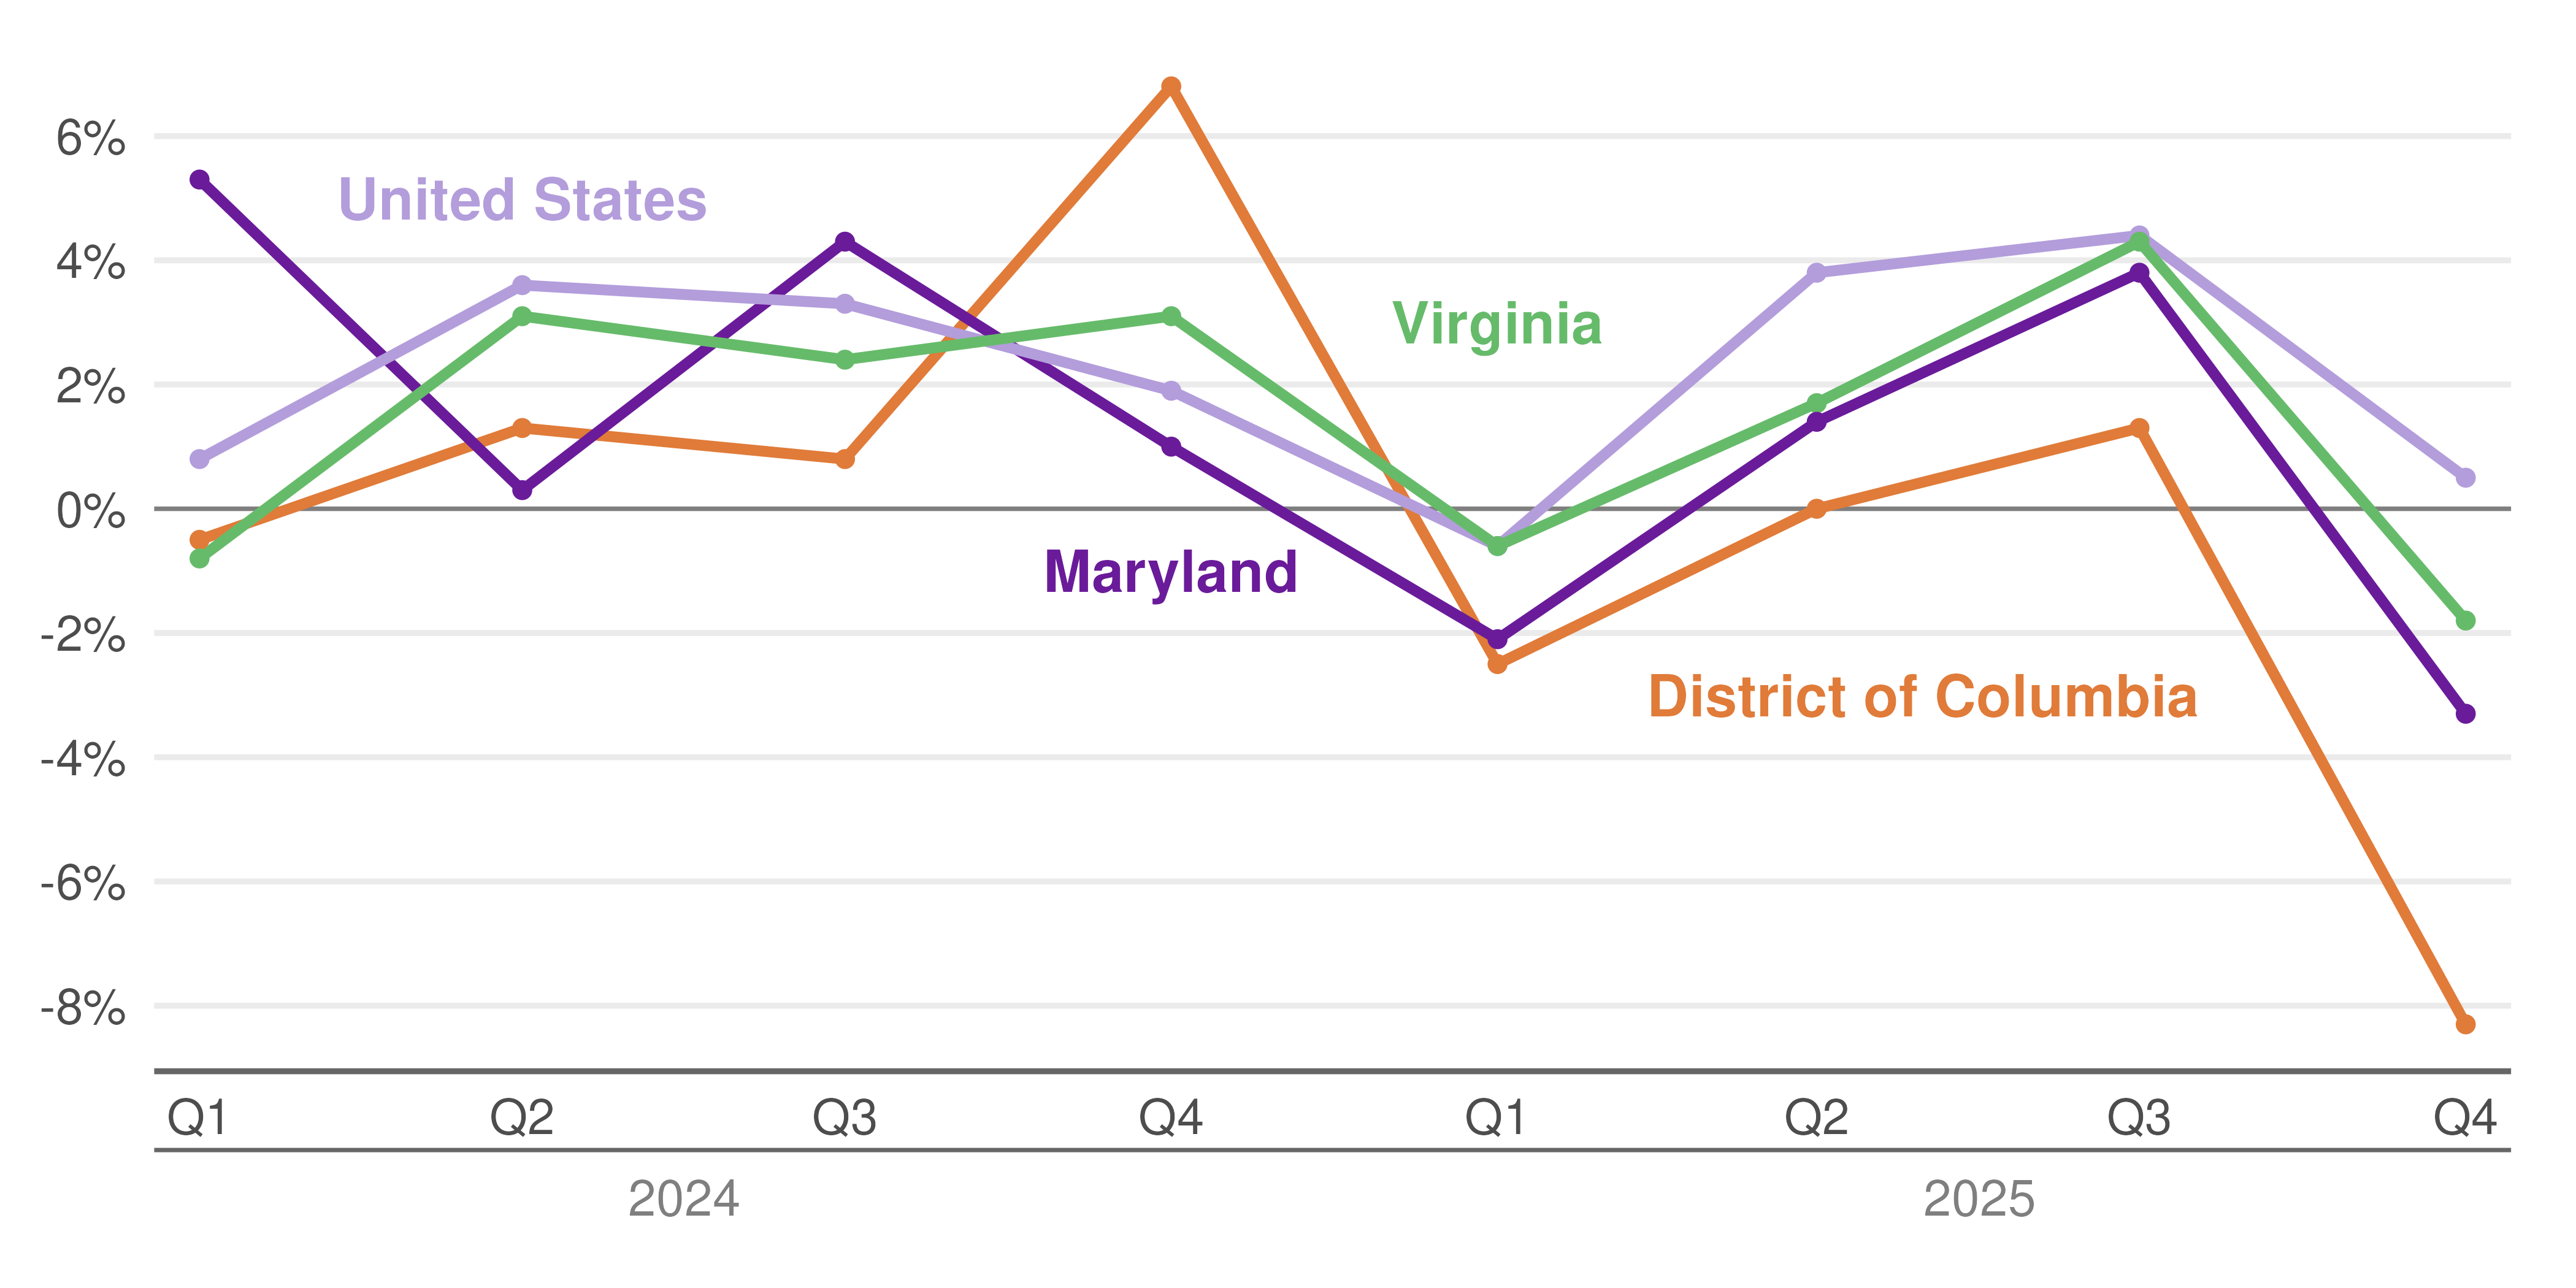
Source: Bureau of Economic Analysis, SQGDP1 State quarterly gross domestic product (GDP) summary Notes: Real GDP is in millions of chained 2017 dollars.
Not all of the Trump Administration changes need have negative consequences for the immediate Capital Region. Workers returning to the office could help the central core at the expense of more outlying jurisdictions. The overall decline in the federal workforce, however, is a large negative economic shock. Yet despite the near 15 percent decline in the size of the federal workforce—and large declines in the hard-to-measure federal contractor workforce—Figure I.2 shows that Capital Region home prices are more or less unchanged from their January 2025 levels. Perhaps even more surprising, total employment in the Capital Region has also seen only a small decline.
Figure I.2: Capital Region Employment Collapses In Trump’s Second Term, While Home Prices and Overall Employment Hold Steady
Changes relative to January 2025: Capital Region home price index, total employment and federal employment
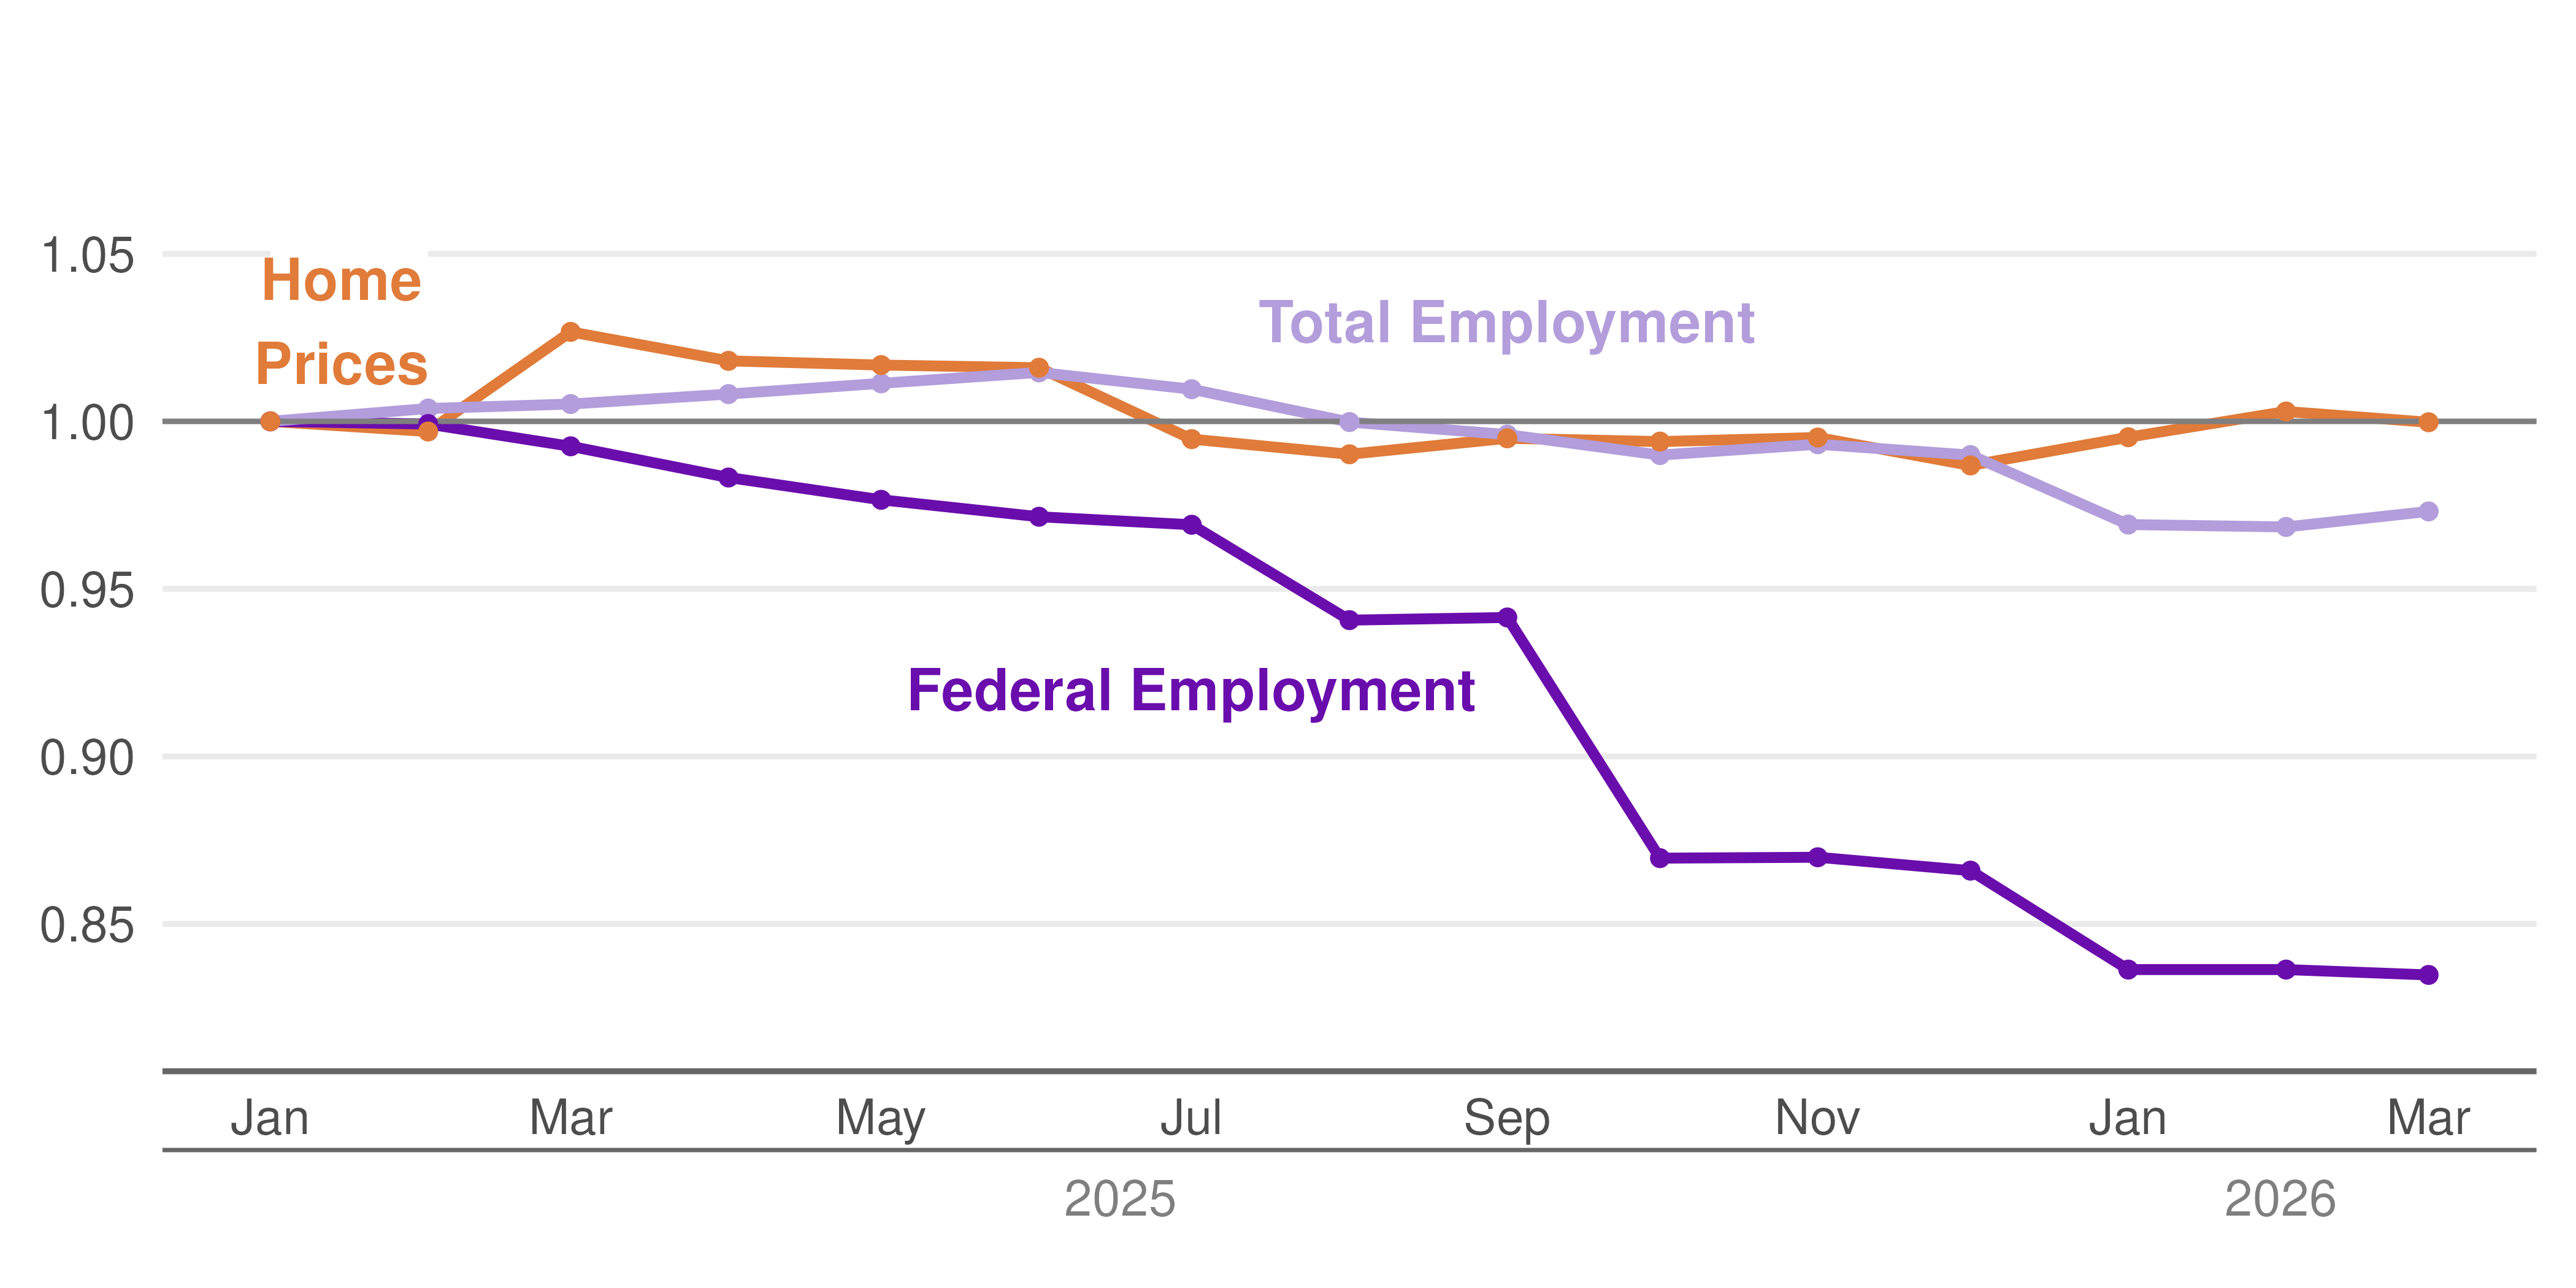
Source: Home price data from BrightMLS, and we calculate home price index (see appendix for index for calculation information), Total and Federal Employment from BLS. Notes: Civilian federal payroll employment only. The value of federal employment in the numerator excludes all federal contractors, uniformed services (DoD and Coast Guard), and military reservists not on active duty, as well as employees of the Central Intelligence Agency, the National Security Agency, the National Imagery and Mapping Agency, and the Defense Intelligence Agency.
In this year’s State of the Capital Region, we dig deeper to assess how the region has responded to this generational change. In Chapter 1, we explore just how big the shock was, how it has increased local unemployment and why it is so difficult to measure the number of federal employees. Chapter 2 shows that this shock has been largest for the District of Columbia, Arlington and Alexandria. All these jurisdictions have large shares of federal employment among residents, and large shares of federal workers in their workforce. Finally, in Chapter 3 we show that the Trump Shock so far is hard to see in overall Capital Region home prices. Even in areas with high shares of federal workers, while we see an increase in home listings, we see no decrease in house price growth or increase in home sales.