Chapter 1: The Magnitude of the Trump Shock
The past year has been a difficult one for the Capital Region’s economy due to widespread federal government layoffs and cuts to spending in areas like foreign aid. In this chapter we contextualize the magnitude of this negative shock.
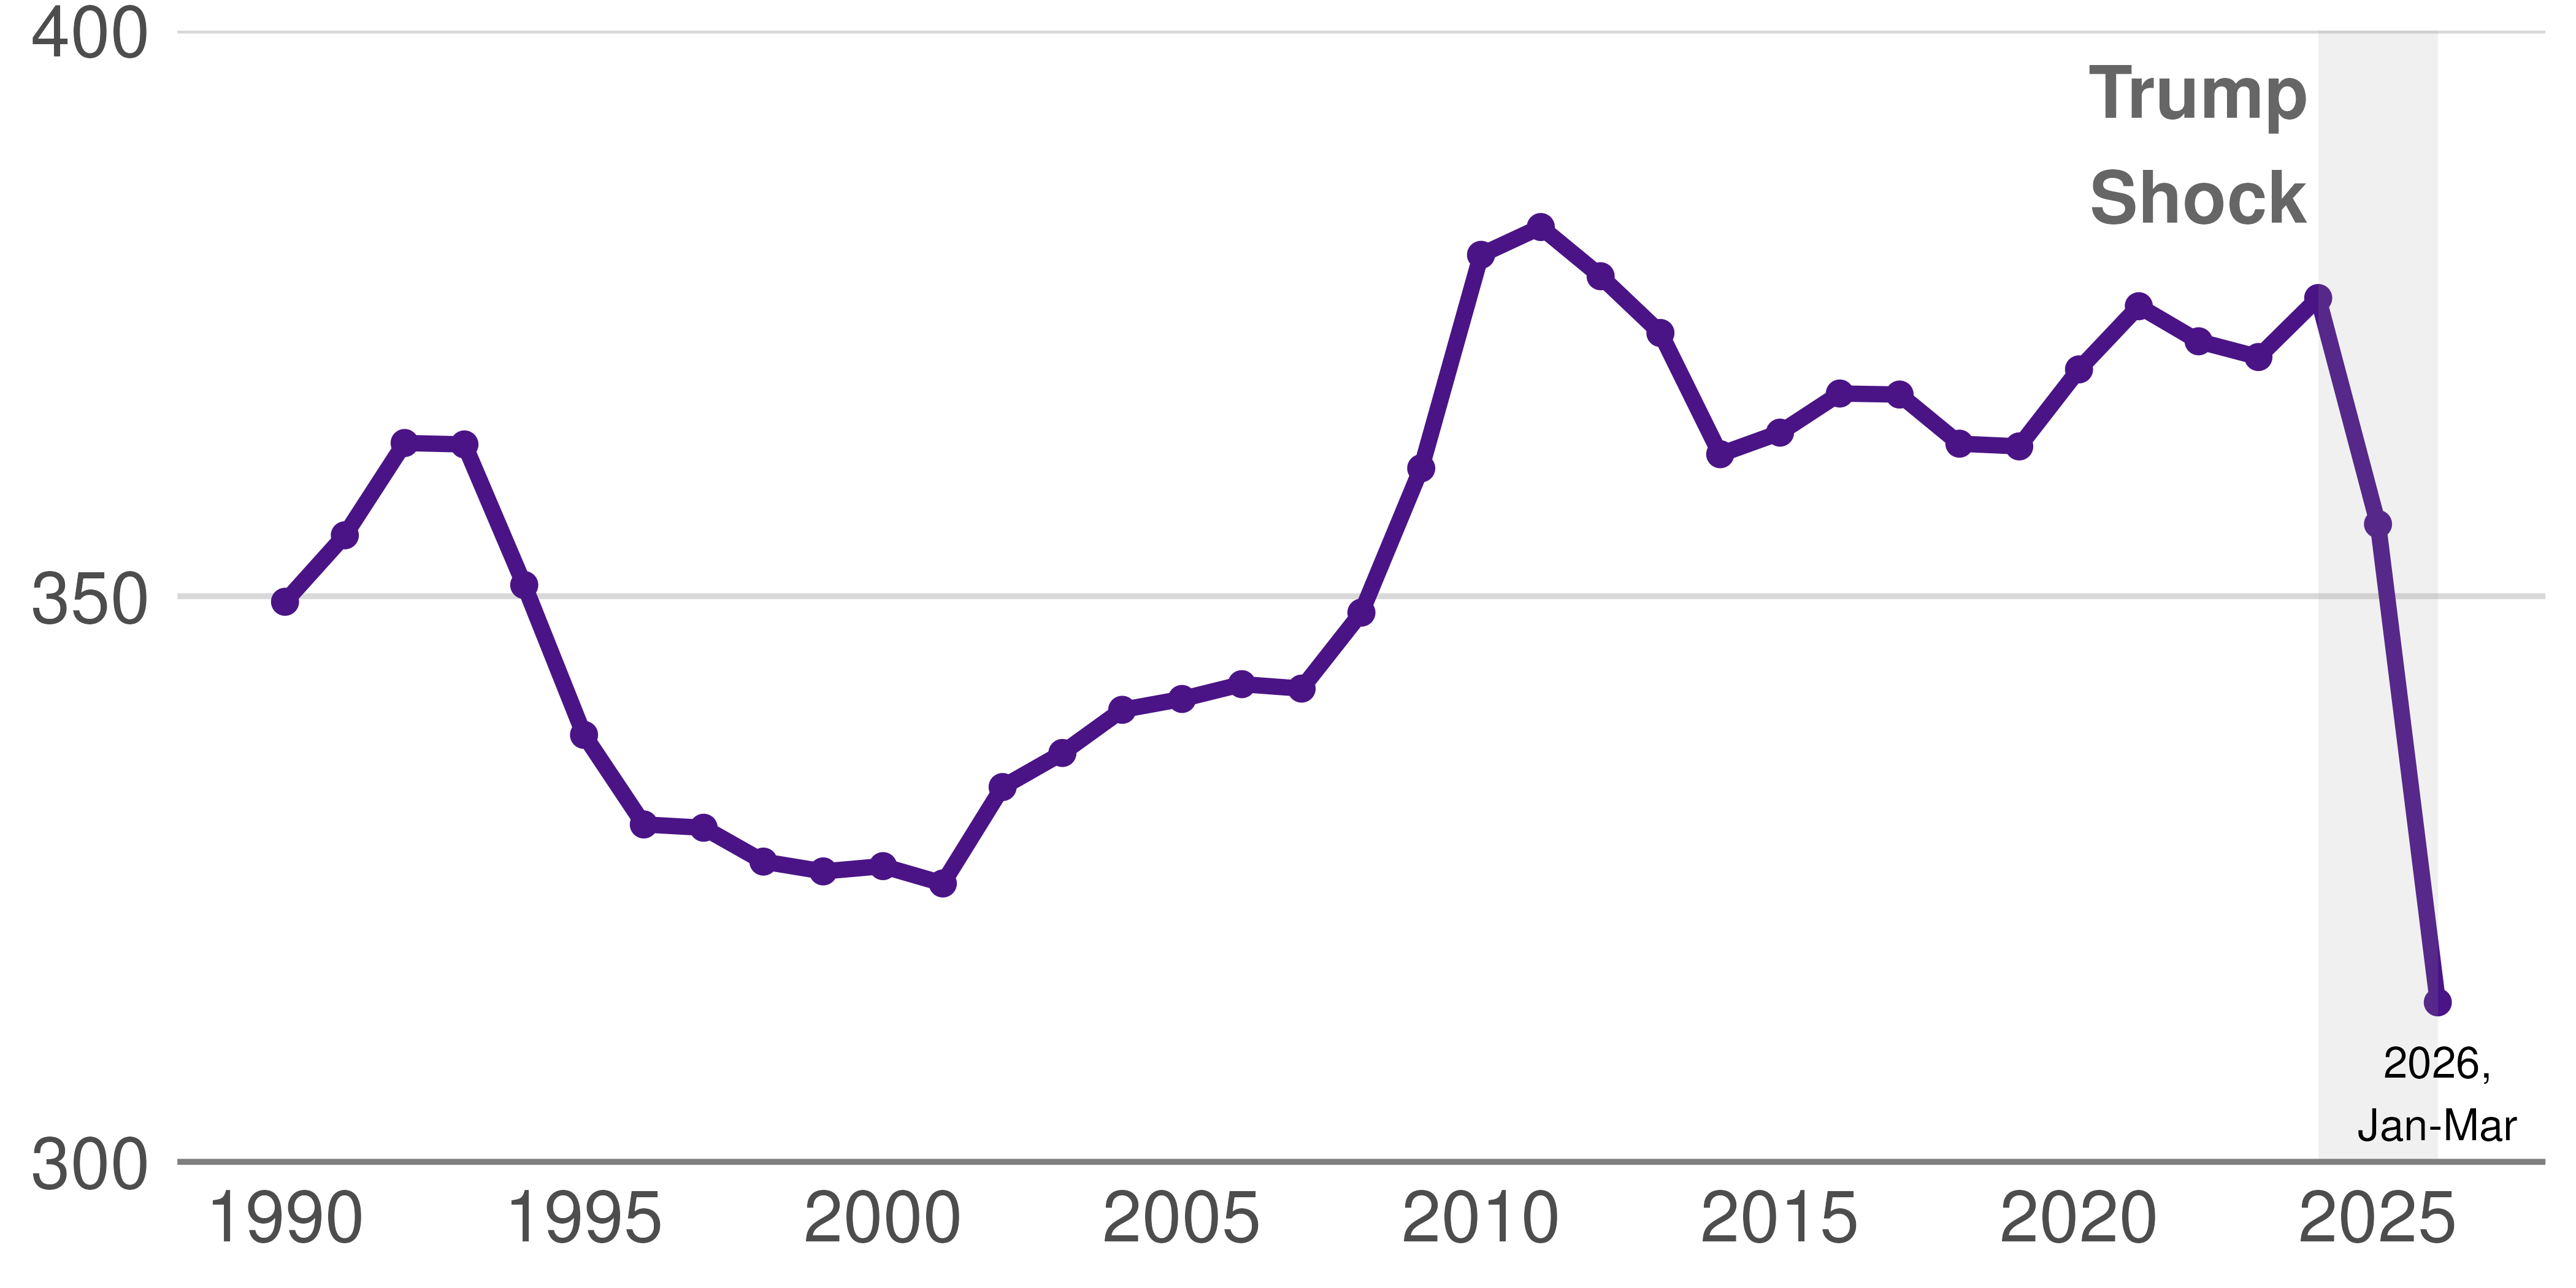
Figure 1.1 shows the size of reduction in federal employment in the region as of November last year. The number of federal employees, excluding uniformed services, in the Capital Region has fluctuated between 325,000 and 380,000 since the early 1990s. As the first quarter of 2026, this number sat at around 315,000, or about 40,000 fewer employees than at the start of the year. To place that decrease into context, until now, the largest decrease in federal employment over the last forty years was the decline from 2009 to 2010. This 2025-2026 decline is larger.
Figure 1.1: Federal Employment in the Capital Region Fell Abruptly in 2025
Federal Workers in the Capital Region in Thousands, 1990 to 2025
Source: Bureau of Labor Statistics CES and State & Metro Area data, 1990-2025. Notes: Data through March 2026. Civilian federal payroll employment only. The value of federal employment in the numerator excludes all federal contractors, uniformed services (DoD and Coast Guard), and military reservists not on active duty, as well as employees of the Central Intelligence Agency, the National Security Agency, the National Imagery and Mapping Agency, and the Defense Intelligence Agency.
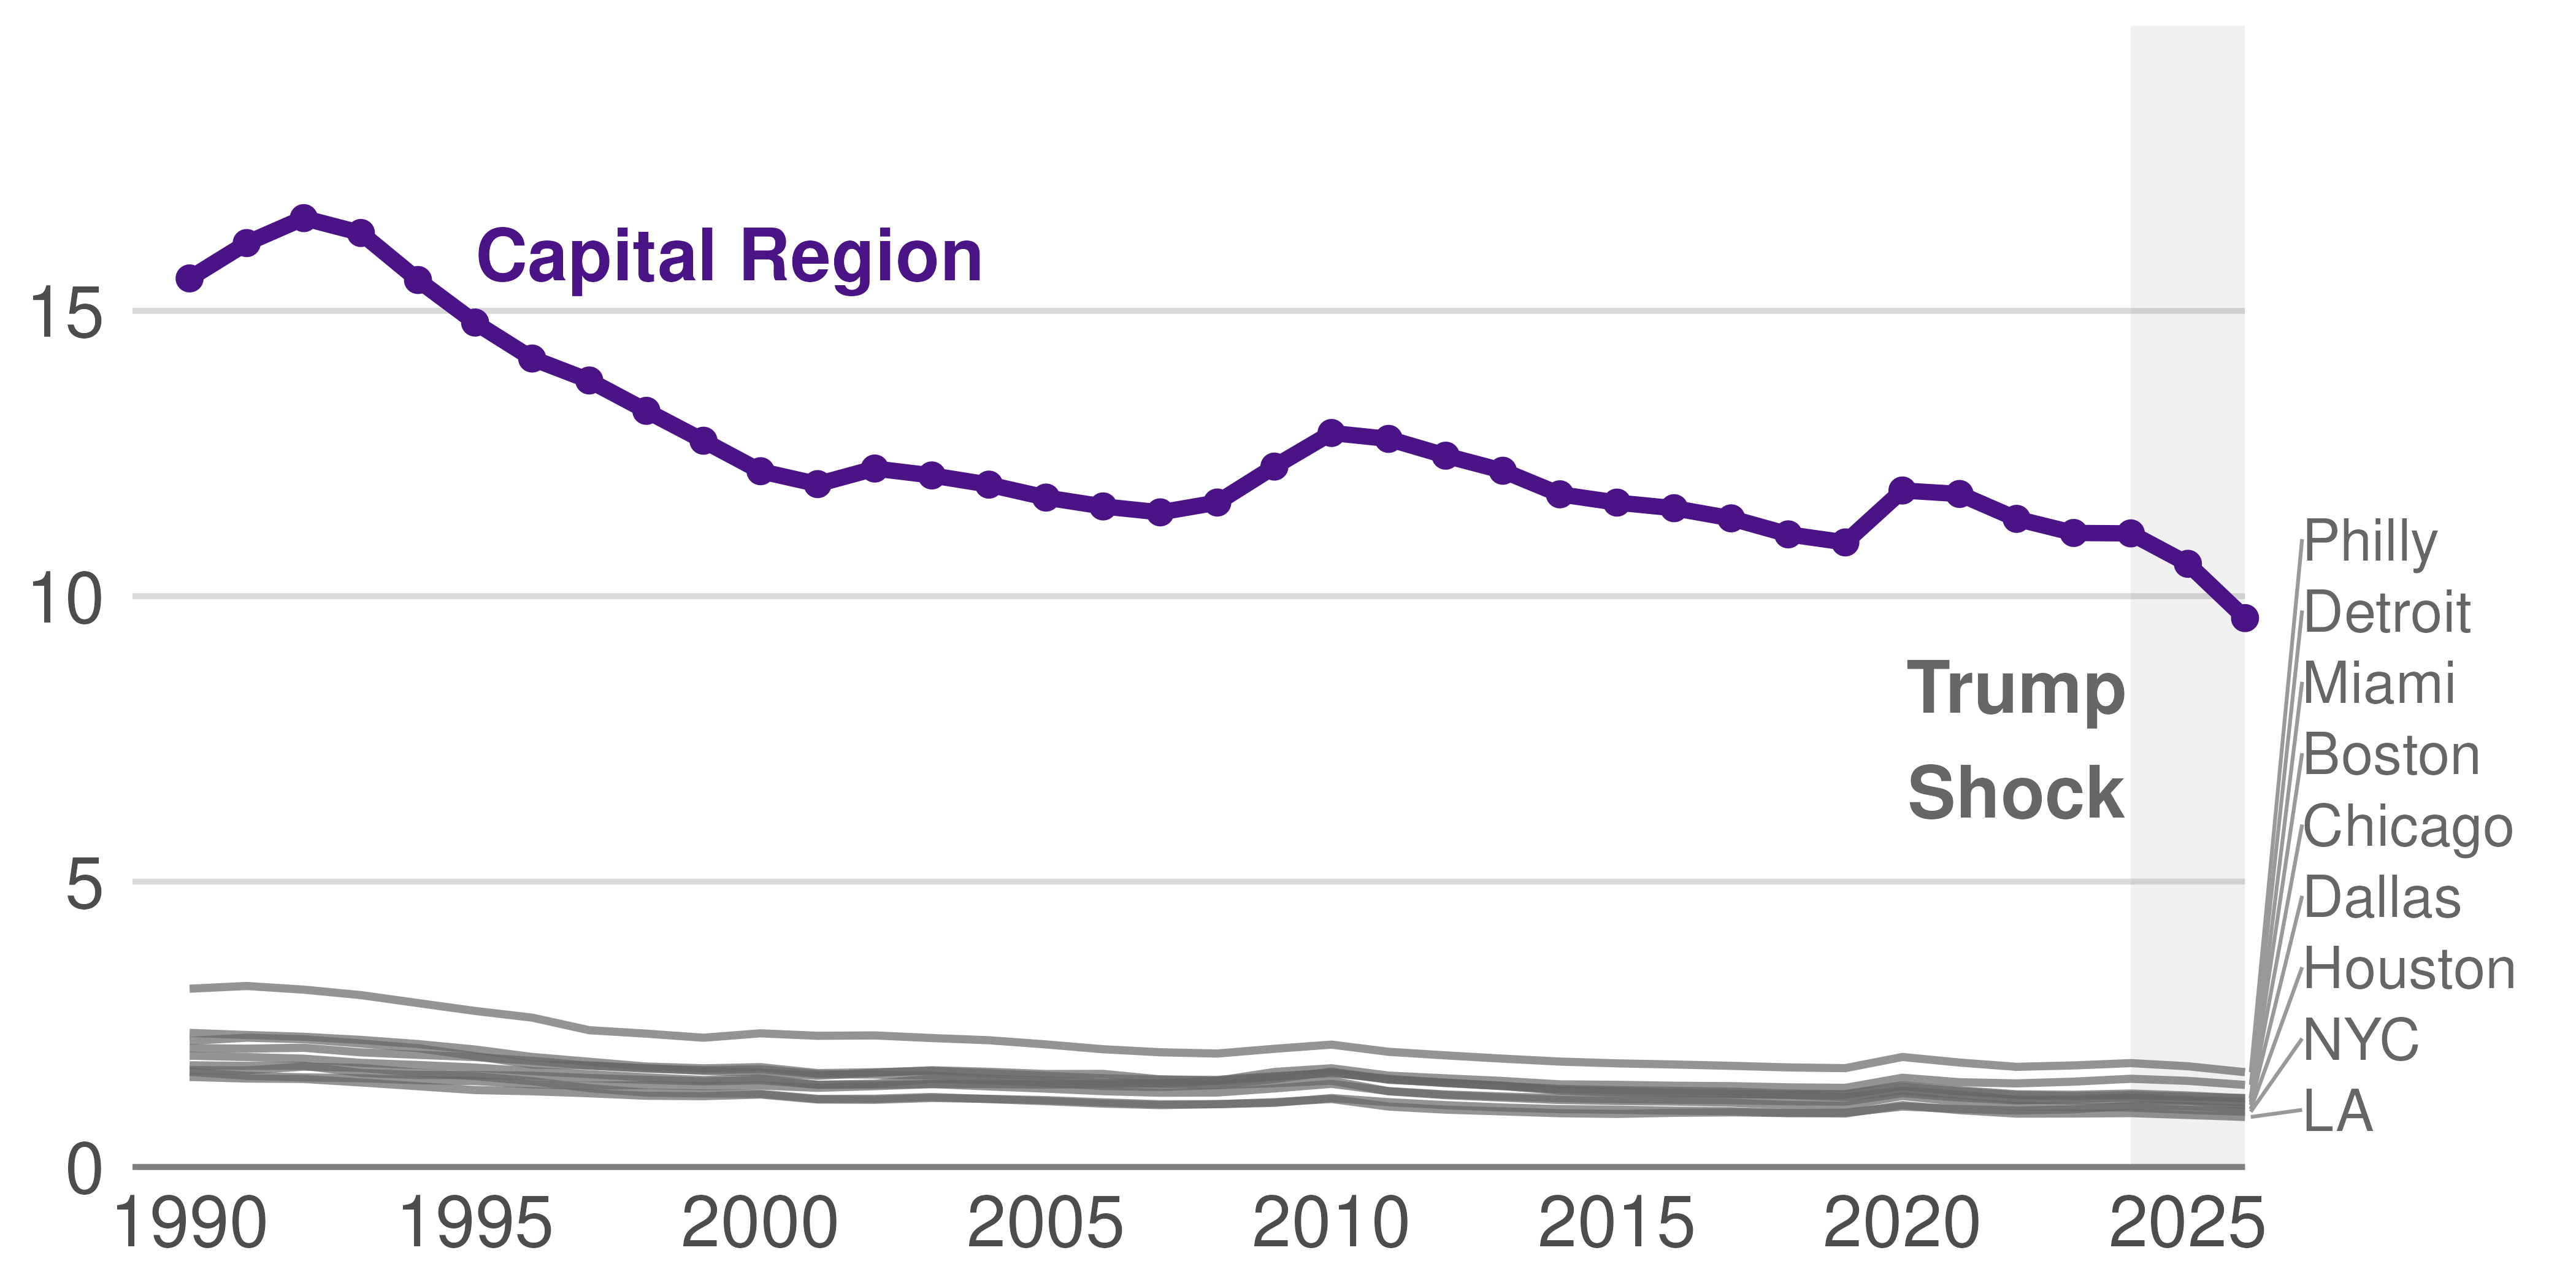
Federal employment is much more important to the Capital Region than it is to other major metro areas. While federal employment as a share of total employment in the Capital Region has declined from over 15 percent in the early 1990s, it remains over 10 percent. Figure 1.2 compares this to the situation in other major metro areas. It illustrates that the Capital Region’s federal employment share remains significantly greater than that in other major metropolitan areas, which are all below 3 percent.
Figure 1.2: Federal Employment Remains More Important in the Capital Region than Elsewhere
Federal Workers as a percentage of all workers, 1990-2025
Source: Bureau of Labor Statistics Current Employment Statistics (Monthly Survey) and State & Metro Area data. Notes: BLS Current Employment Statistics (CES) All Employees, Federal Government divided by All Employees, Total Nonfarm. The value of federal employment in the numerator excludes all federal contractors, uniformed services (Department of Defense and Coast Guard), and military reservists not on active duty, as well as employees of the Central Intelligence Agency, the National Security Agency, the National Imagery and Mapping Agency, and the Defense Intelligence Agency. BLS CES includes US Postal Service. For 2026, we report the average of January-March.
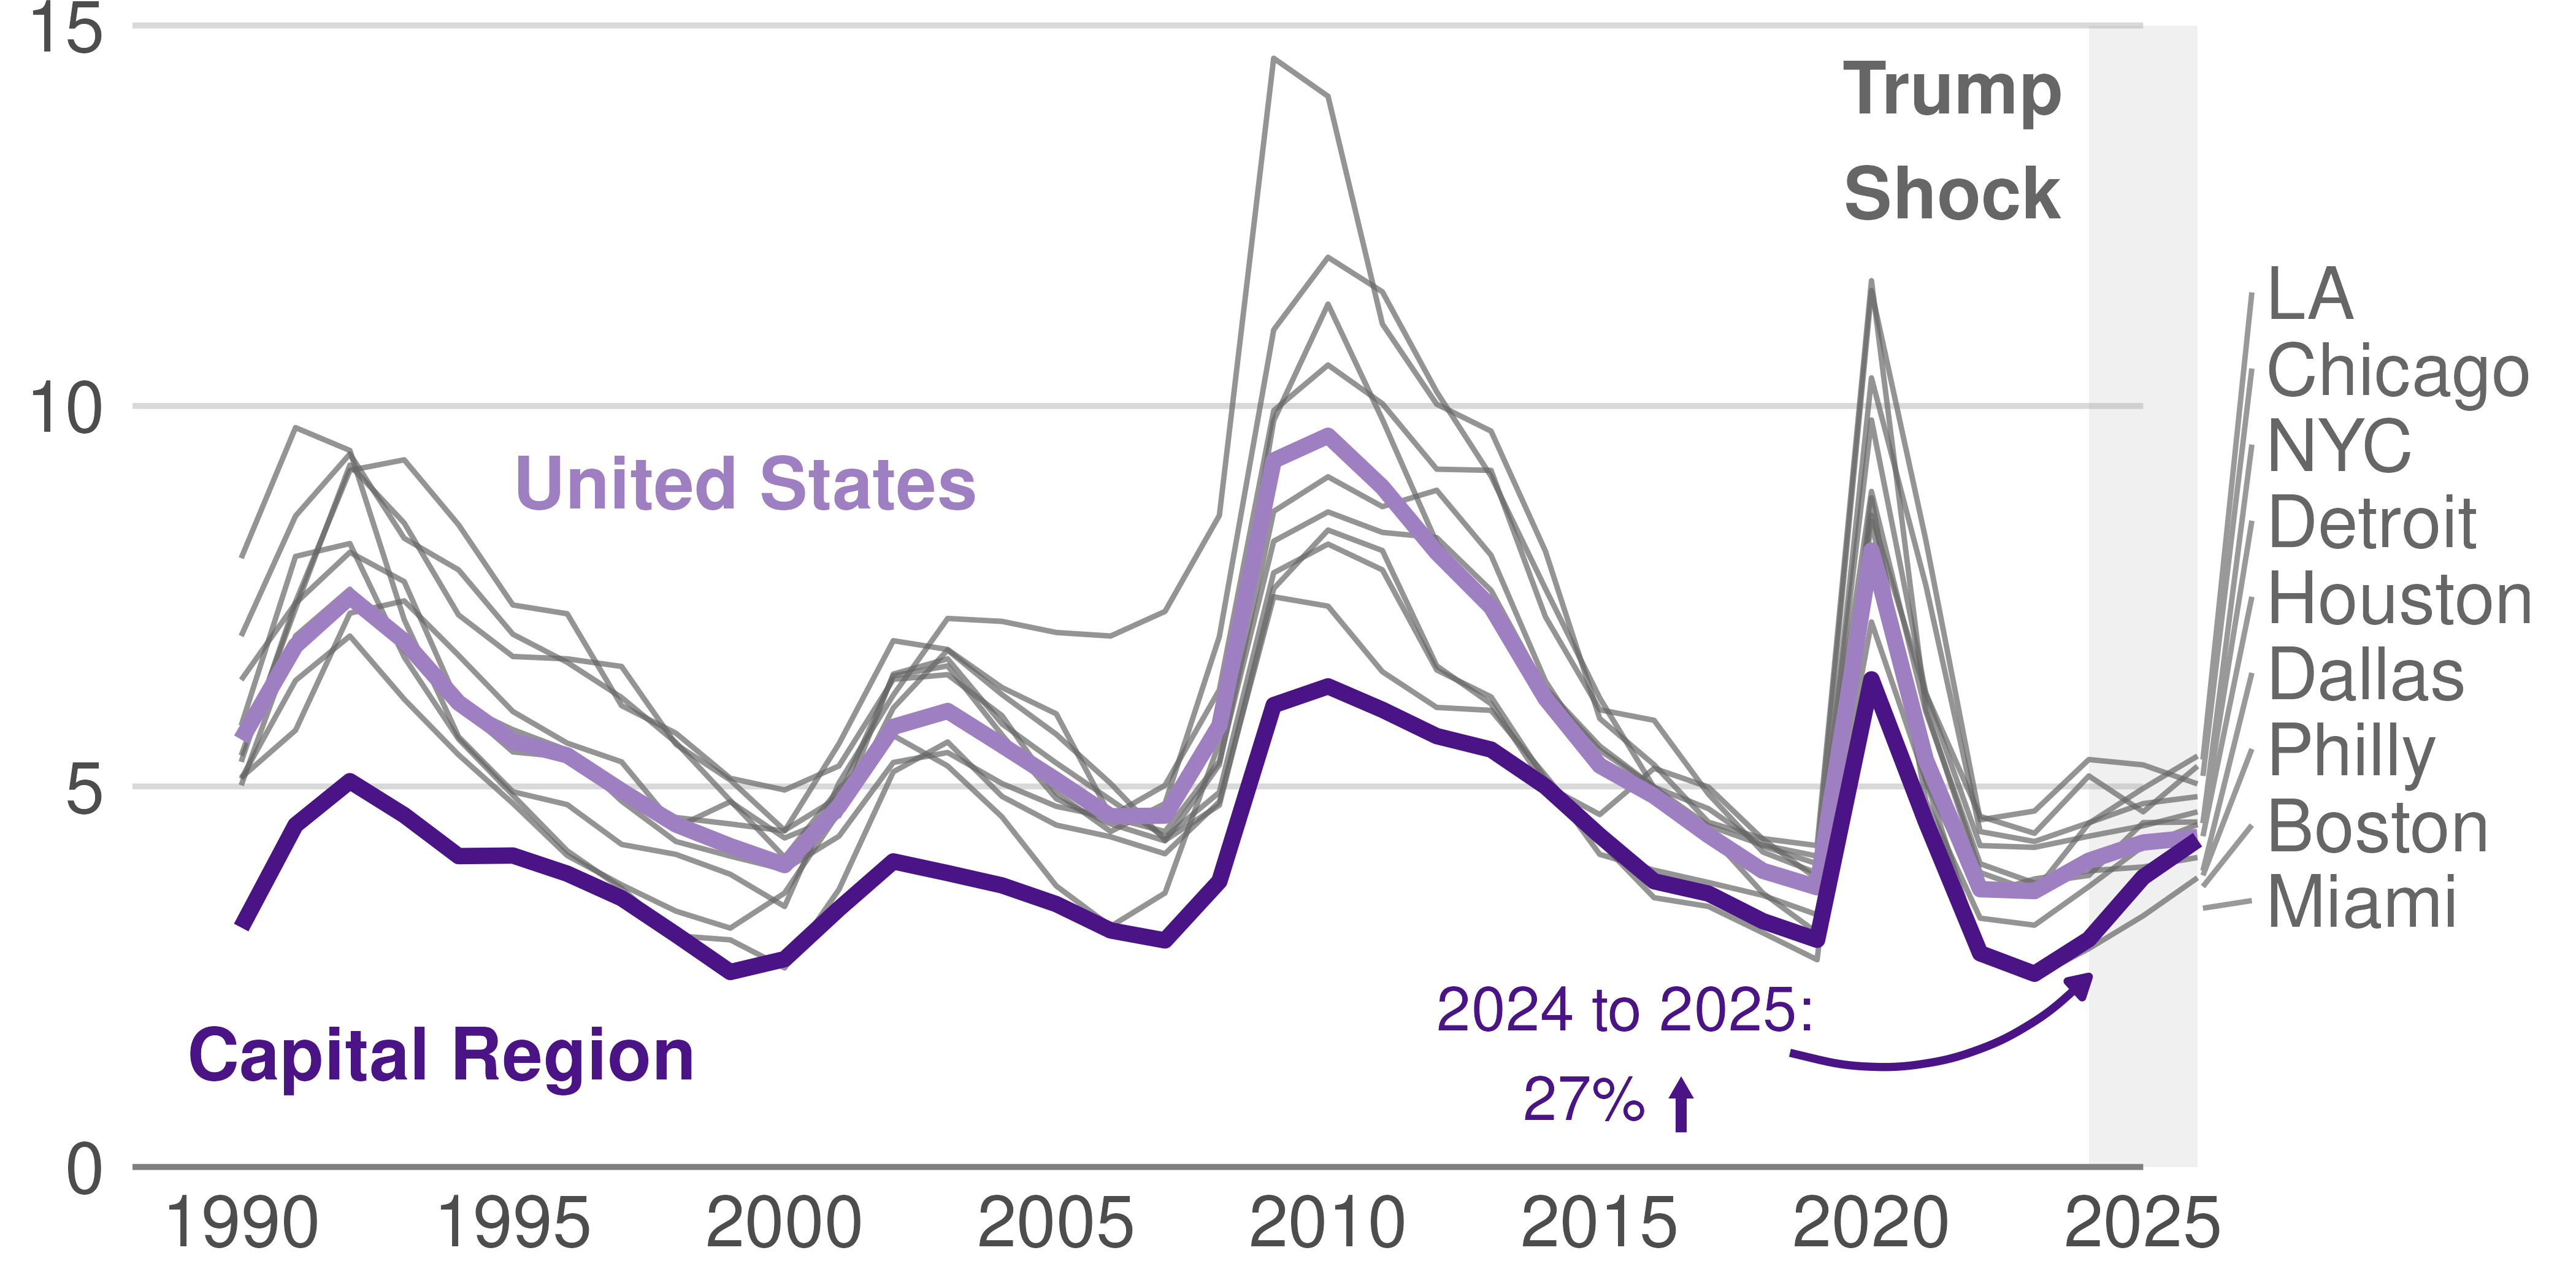
The second Trump administration’s negative shock to federal employment has had a direct impact on the Capital Region’s broader labor market. The Capital Region has long enjoyed lower and less volatile unemployment rates than the nation as a whole as well as other major metros, as Figure 1.3 illustrates. Over the past year, this appears to have started changing. The Capital Region’s unemployment rate has increased faster than the national unemployment rate and is closer to it than it has been in at least 35 years. When we compare the Capital Region to other major metropolitan areas shown in grey, the same picture emerges. The unemployment rate in the Region has risen faster than in those other metro areas, and now exceeds Miami’s unemployment rate.
Figure 1.3: The Unemployment Rate in the Capital Region Has Risen Faster Than Elsewhere
Percent Unemployed, Major Metros, Capital Region, and United States, 1990-2025
Source: Data from the U.S. Bureau of Labor Statistics. Unemployment rates come from BLS Local Area Unemployment Statistics, National rates from Current Population Survey, downloaded from the Census. All rates are seasonally adjusted by BLS. Due to the government shutdown, we omit October 2025. For 2026, we report the average of January-March.
It’s Hard to Measure Federal Workers
Though many datasets measure federal workers, all of them are flawed in some way. Many of them don’t capture key federal sectors, and none of them measure the shadow federal workforce of contractors.
The data that we use in Chapter 1 from the Bureau of Labor Statistics omits uniformed services (Department of Defense and Coast Guard), and employees in the Intelligence Community (Central Intelligence Agency, National Security Agency, National Imagery and Mapping Agency, and Defense Intelligence Agency). While total employment in the Intelligence Community is small, it is very large in certain parts of the Capital Region, particularly near NSA headquarters at Fort Meade, Maryland and CIA headquarters in McLean, Virginia.
While the Longitudinal Employer–Household Dynamics Origin–Destination Employment Statistics (LODES) data that we use in Chapter 2 allows us to measure very geographically detailed federal employment, we know that it also omits perhaps even more federal workers. In addition to the agencies not collected by the Bureau of Labor Statistics, this data source also omits federal workers from the Federal Bureau of Investigation, the Drug Enforcement Administration, the Secret Service, the State Department, the Foreign Service, the Federal Reserve, the USPS, the judicial branch, and non appropriated fund employees.
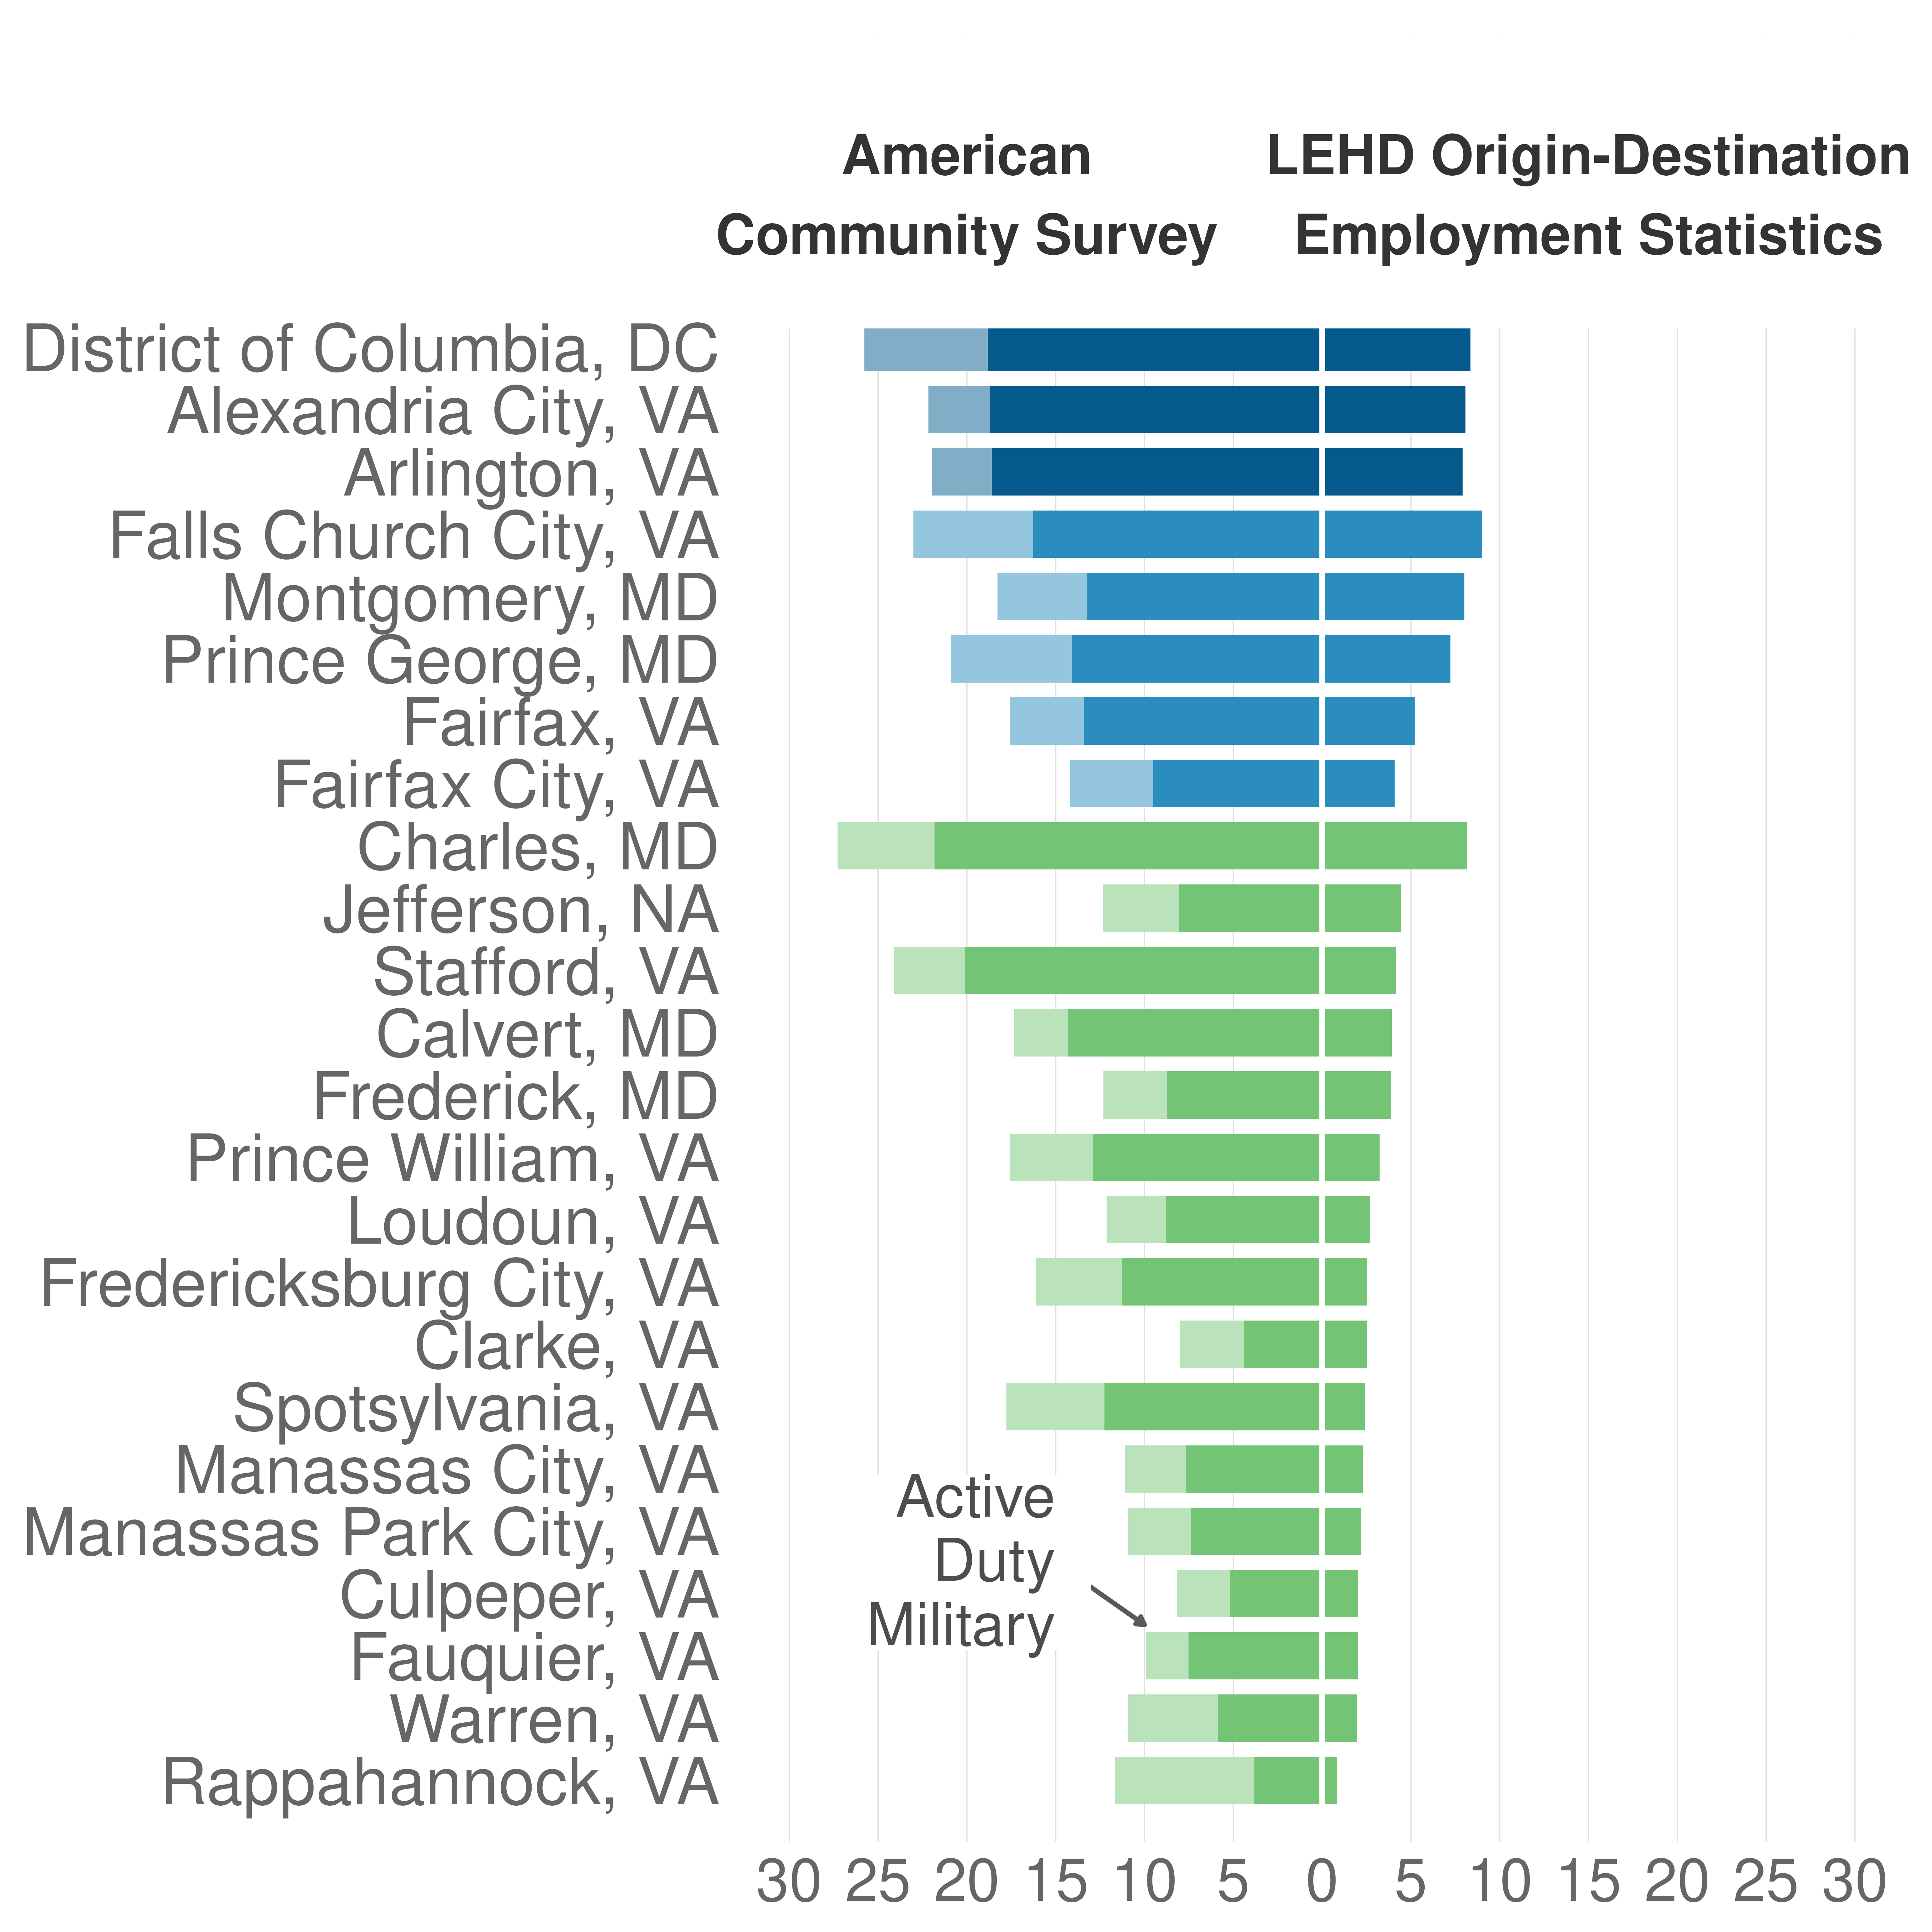
The American Community Survey also measures federal workers, and its coverage seems to be more comprehensive—it asks workers if they work for the federal government regardless of branch. Figure B1 compares the share of federal workers, by jurisdiction, reported by the American Community Survey on the left and the LODES on the right. In all cases the American Community Survey reports a higher share of federal workers. If we add in active duty military – as the lighter colored bar on the left reports, that discrepancy increases only further.
But even at their best, all of these data sources omit one very large component of the federal workforce: contractors. While no data source measures contractors directly, credible estimates suggest that, as of 2020, the number of federal contractor workers exceeded the sum of federal employees, postal workers and active duty military members.
Figure B.1: Different Government Surveys Report Radically Different Shares of Federal Workers
Share federal workers from LEHD LODES and American Community Survey federal worker + active duty(shaded) shares
Source: LEHD Origin-Destination Employment Statistics(LODES) Residence Area Characteristics (Jobs held by residence of federal worker/total jobs held by residence), ACS Table B24080 (Sex by Class of Worker for the Civilian Employed Population 16 Years and Over)(Male + Female Federal Worker Totals and Total Employed Civilian Population 16+), ACS Table B23025 (Employment Status for the Population 16 Years and Over)(Residence-based Active Duty Totals). Notes: LODES excludes federal workers including CIA, NSA, FBI, DEA, Secret Service, State Dept, Foreign Service, Federal Reserve, USPS, intelligence agencies, judicial branch, and non appropriated fund employees