Chapter 2: Where Federal Workers Live and Work
In this chapter, we explore the potential impact of federal workforce downsizing across the Capitol Region. To map which parts of the Region are most exposed to federal workforce changes, we use the Longitudinal Employer–Household Dynamics (LEHD) Origin–Destination Employment Statistics (LODES). Two caveats matter for interpretation: LODES captures only about half of the federal workforce, and for some agencies the Census makes a reasoned guess to match workers to federal establishments. The results below, therefore, describe relative exposure across jurisdictions rather than a full headcount of federal employment.
We analyze exposure from both a workplace and a residence perspective. This distinction matters because a reduction in the federal workforce affects local economies through two linked channels. The first is income: if a displaced worker does not quickly find comparable employment, household income falls. The second is where time is spent: time previously spent commuting to, and working in, federal job centers is partly reallocated toward time at home and in nearby neighborhoods. Chapter 1 shows that the current downsizing is, so far, associated with higher unemployment, consistent with both channels operating at once.
Lower income reduces household spending on goods and services across the board, including housing. It also triggers a shift from purchasing services in the market, such as meals out, to home production, such as making meals at home. Meanwhile, the shift in where people spend their days redistributes the remaining, lower-level spending away from federal employment centers and toward residential areas.
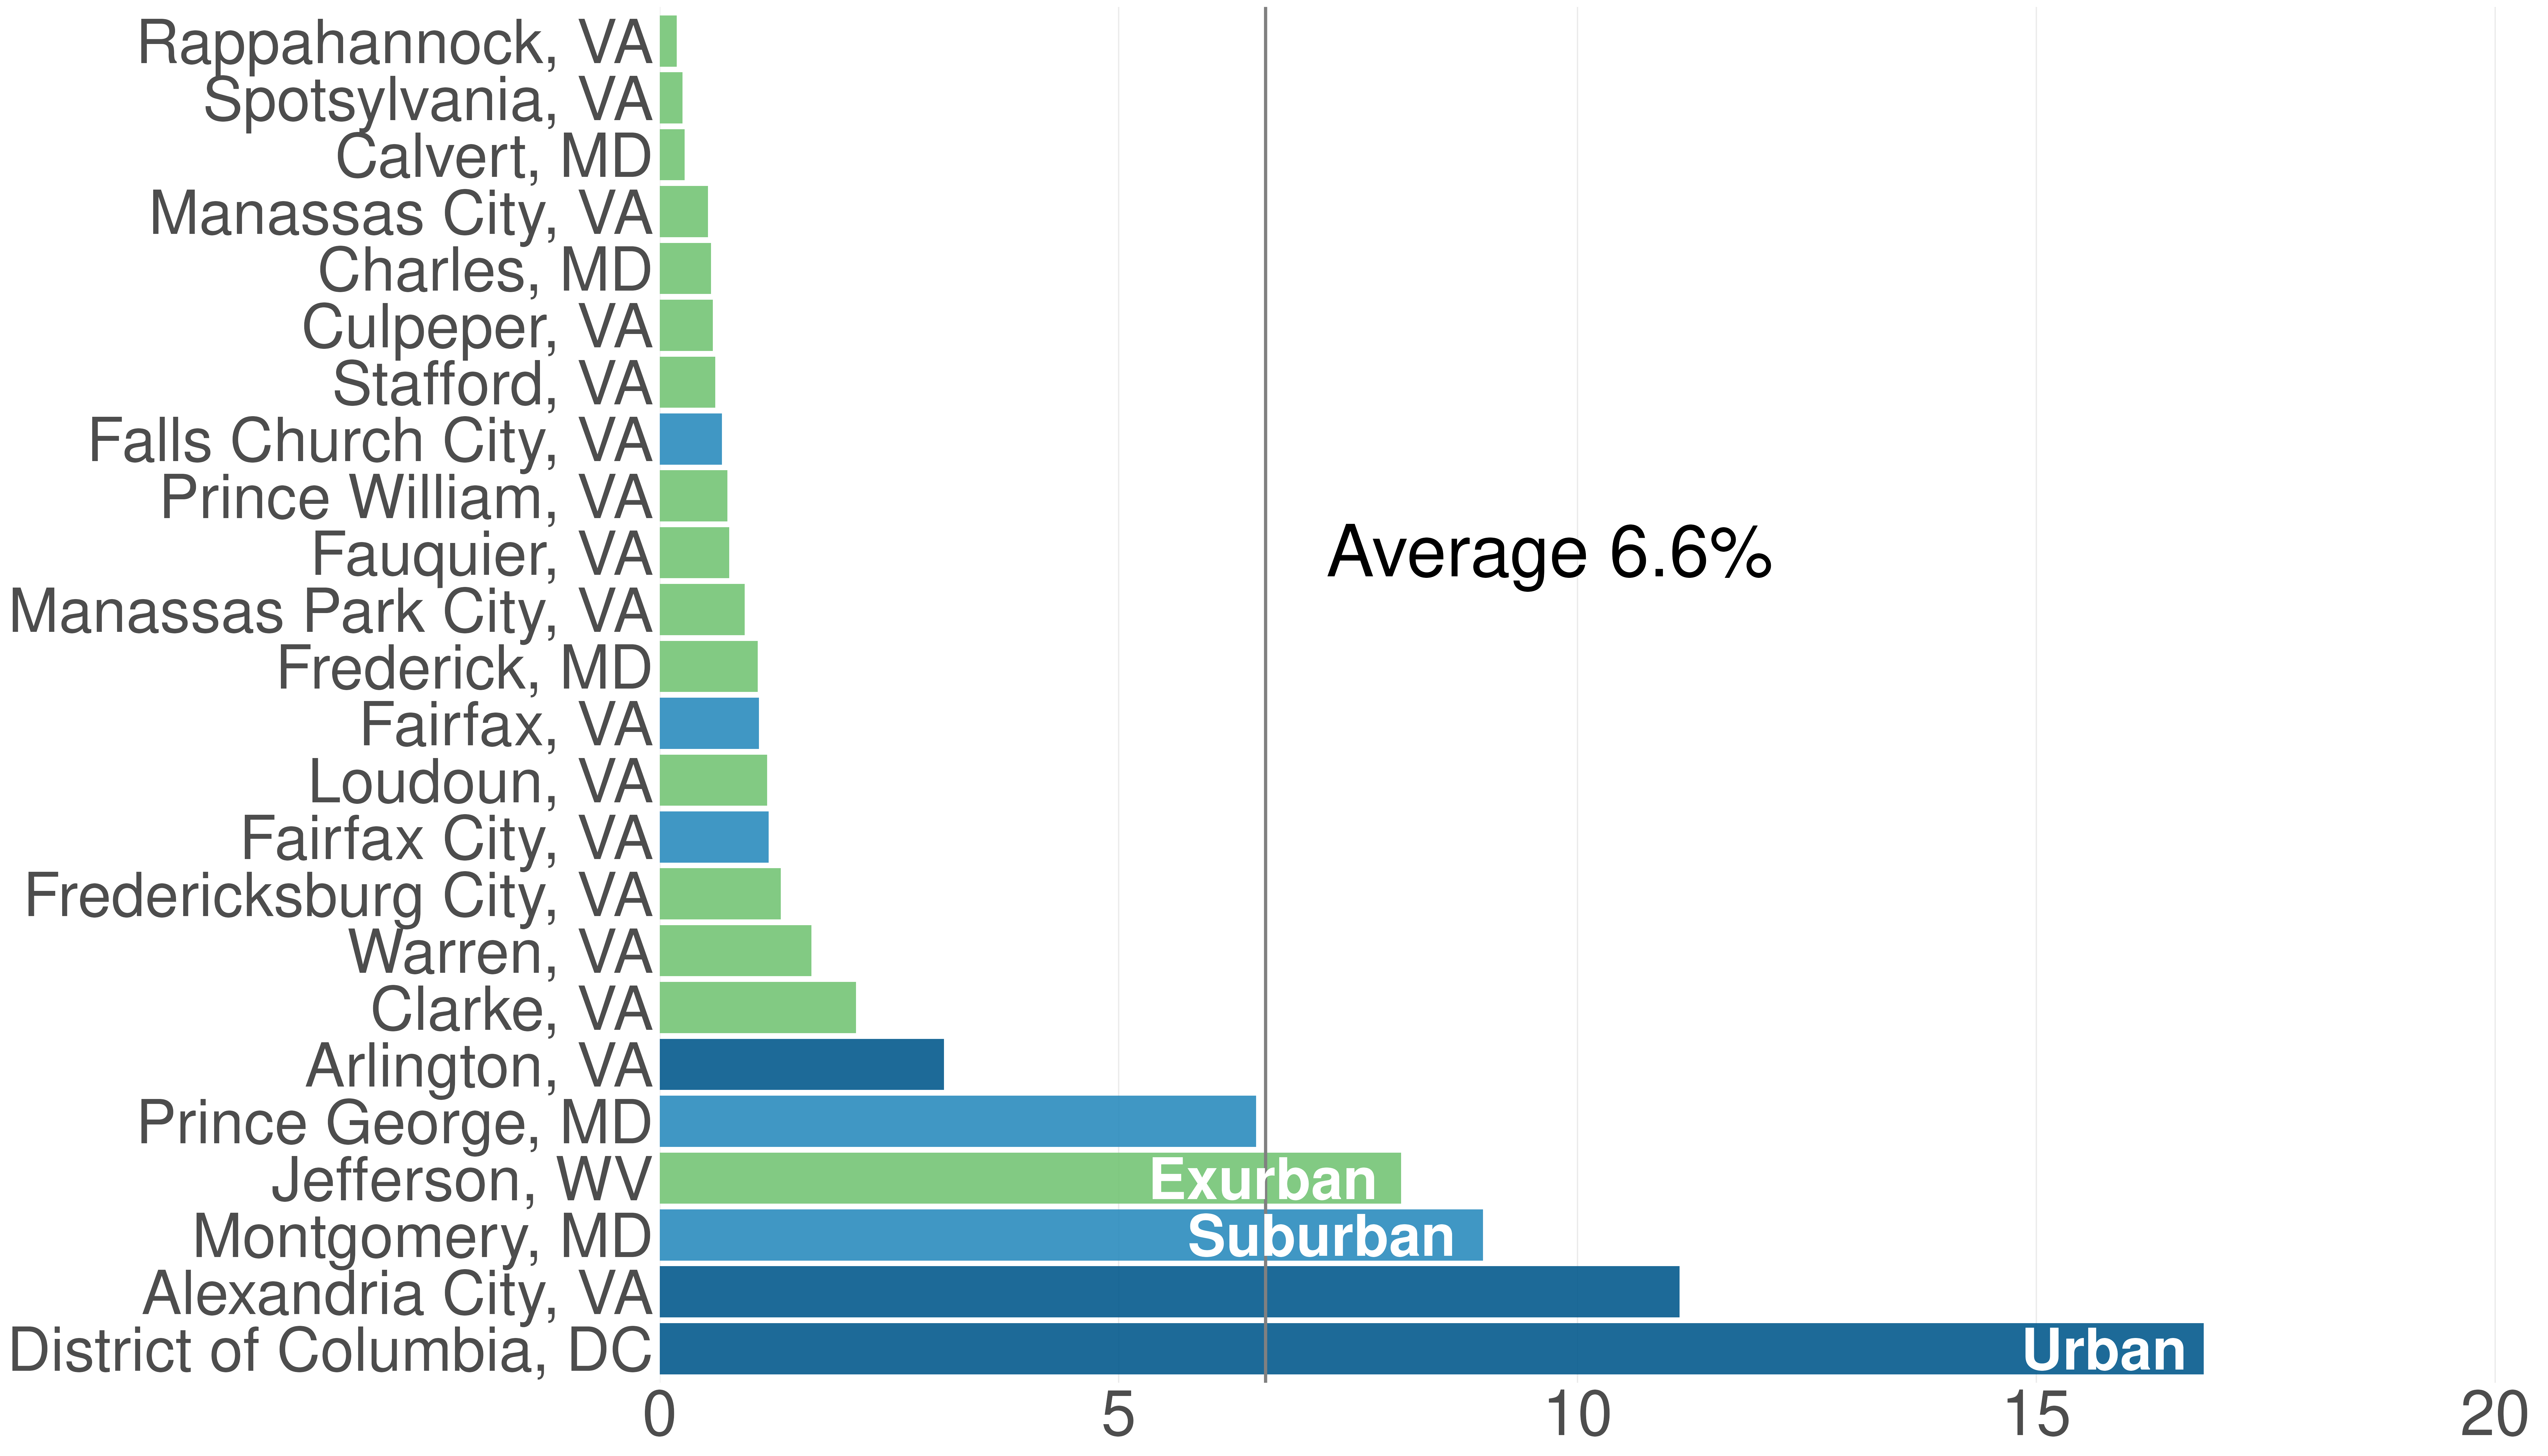
We start with the workplace perspective. Figure 2.1 reports federal workers as a share of employment by jurisdiction. A small number of urban and suburban jurisdictions depend heavily on federal employment. In 2022, in Prince George’s County, Jefferson County, Montgomery County, and the City of Alexandria federal workers account for between 6.5 and 11 percent of local employment. The District is the clear outlier, with about 17 percent of its employment in the federal workforce. Most other jurisdictions fall well below this range, with federal employees accounting for fewer than 3 in 100 workers.
Figure 2.1: Federal Jobs Account for Outsize Share of Workers in District, Alexandria, and Montgomery County
Share of workers with federal jobs: Federal jobs in jurisdiction divided by total jobs in jurisdiction
Source: LODES Workplace Area Characteristics (Jobs held by total workers by place of work / Total workers place of work) Notes: LODES excludes federal workers including CIA, NSA, FBI, DEA, Secret Service, State Dept, Foreign Service, Federal Reserve, USPS, intelligence agencies, judicial branch, and non appropriated fund employees Estimated totals of agencies omitted from LODES: https://docs.google.com/spreadsheets/d/1PeAvgSJwe2urOVzNup5bCD9R5mBmQ9DFrIW6auwfY84/edit?usp=sharing
Workplace exposure is central to understanding near-term impacts around employment centers. If federal job losses are not offset by private-sector growth in the same locations, fewer workers will come to work each day, and the remaining workers will spend fewer total dollars in nearby restaurants, retail, and personal services. All else equal, affected businesses face weaker revenue, less ability to sustain current staffing, and less capacity to pay current commercial rents. Over time, these pressures can translate into higher vacancies, renegotiated leases, and downward pressure on commercial rent levels in the most exposed locations.
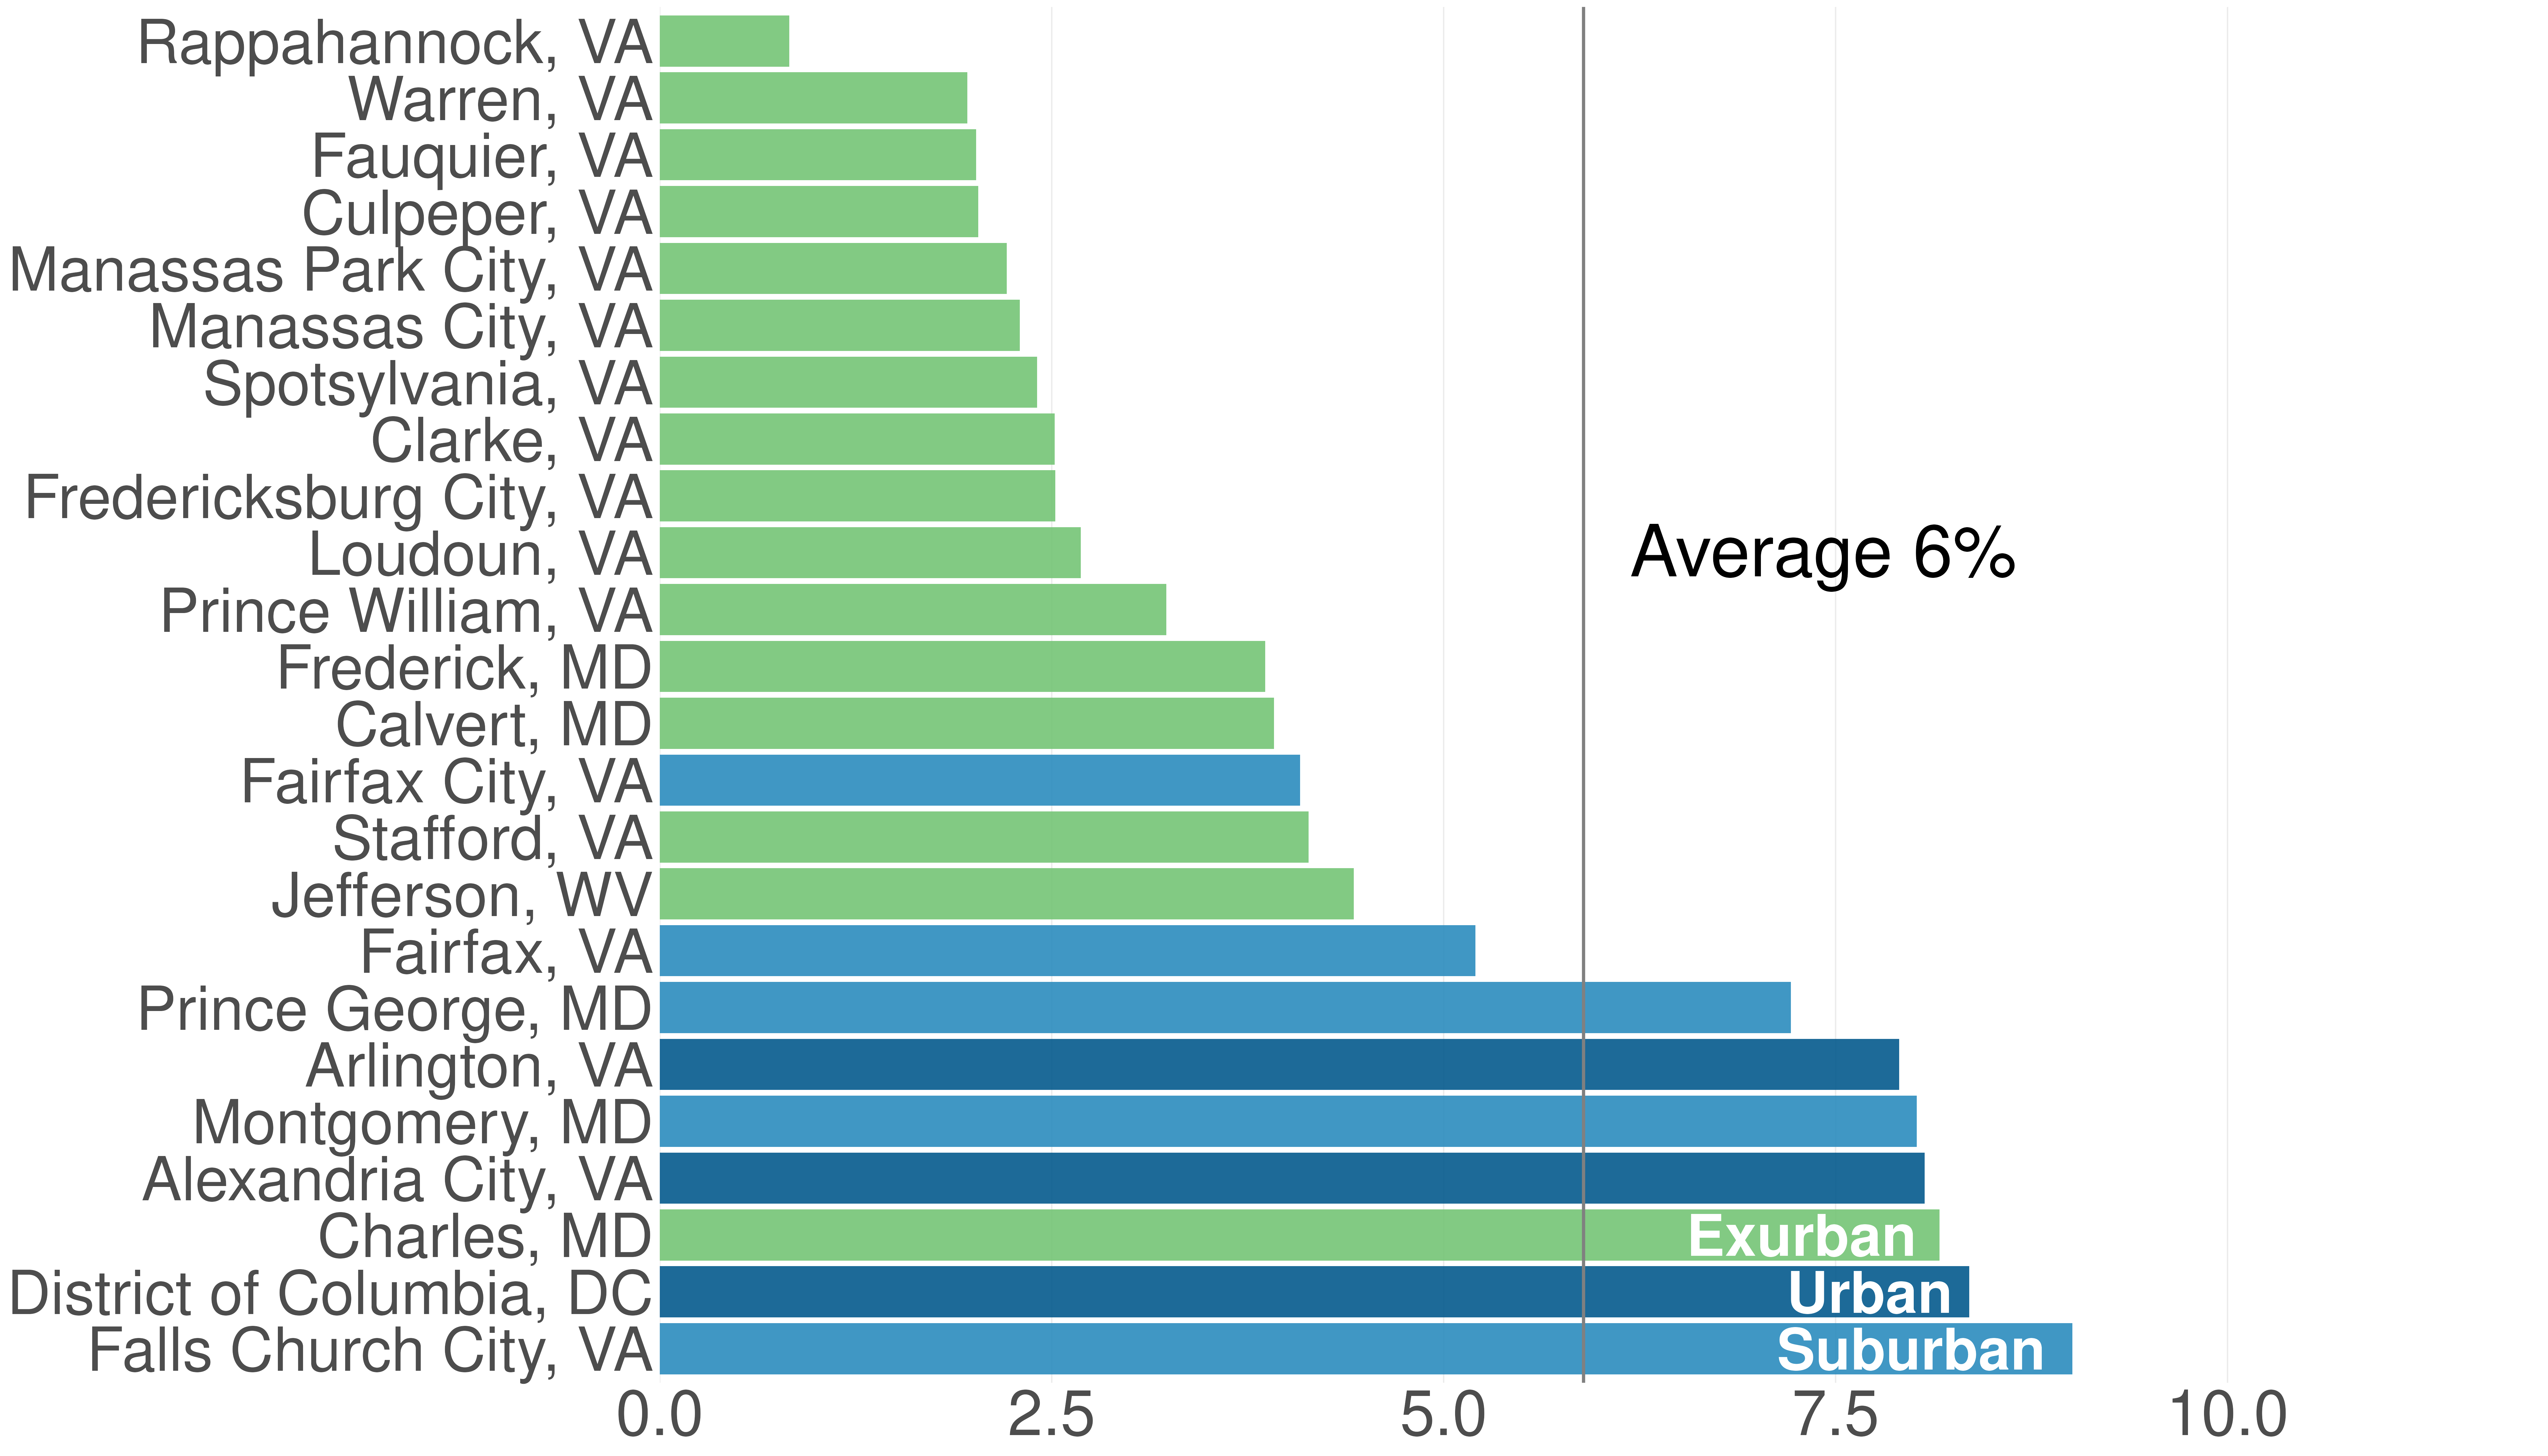
Figure 2.2 shifts to the residence perspective, showing the share of working residents in each jurisdiction who are employed by the federal government. Exurban jurisdictions tend to have relatively low direct exposure for their residents, with about 2 to 3 percent of employed residents in federal jobs in 2022. In urban and suburban jurisdictions, however, typically 7 to 8 percent of employed residents are in the federal workforce.
Figure 2.2: Urban and Suburban Locations Have Greater Exposure to Federal Workforce Downsizing
Share of residents with federal jobs: Jurisdiction residents with federal jobs divided by total working residents of jurisdiction
Source: LODES Residence Area Characteristics. Notes: LODES excludes federal workers including CIA, NSA, FBI, DEA, Secret Service, State Dept, Foreign Service, Federal Reserve, USPS, intelligence agencies, judicial branch, and non appropriated fund employees. Average is sum of complete DC metro federal workers by residence / sum of total workers by residence.
Estimated totals of agencies omitted from LODES: https://docs.google.com/spreadsheets/d/1PeAvgSJwe2urOVzNup5bCD9R5mBmQ9DFrIW6auwfY84/edit?usp=sharing
We should therefore expect a larger pullback in neighborhood spending and home prices in these jurisdictions as affected households cut consumption and adjust their budgets. Some of this reduction might be partly compensated by the fact that foot traffic shifts away from the initial employment centers, redistributing retail and personal services demand closer to residential centers. Because income losses also reduce residents’ ability to pay existing rents and mortgages, resident exposure points to potential downward pressure on residential real estate markets.
The timing of these effects likely differs. Retail and service spending can fall quickly: households can trim discretionary purchases immediately, and reduced daytime foot traffic shows up right away. Housing market impacts may unfold more slowly. Lease renewals and moves are often tied to the school year and other life-cycle timing, and some workers may receive temporary buffers (including voluntary separation incentives) that delay housing adjustments. Recall that while the federal job cuts were announced in early 2025, many of them did not come to fruition until near the end of the year. As a result, residential rent effects may lag the initial retail response even when the underlying shock is the same. Comparing workplace and residence exposure highlights where risks may be compounded. Prince George’s County, Montgomery County, the City of Alexandria, and the District all have relatively high workplace and residence exposure. These jurisdictions face a double vulnerability: they may lose spending around job centers because federal jobs are located there, and they may see reduced neighborhood demand because many federal workers live there. This double exposure may make them especially sensitive to federal workforce downsizing. Most exurban locations, on the other hand, have a relatively low residential and workplace exposure, suggesting a more muted impact of federal downsizing. While the new presidential administration cut federal employment, it also increased the share of federal workers–among those who remain–who worked in person. This return to work, which began in January 2025, could benefit jurisdictions where federal workers were more likely to work from home before this policy change.
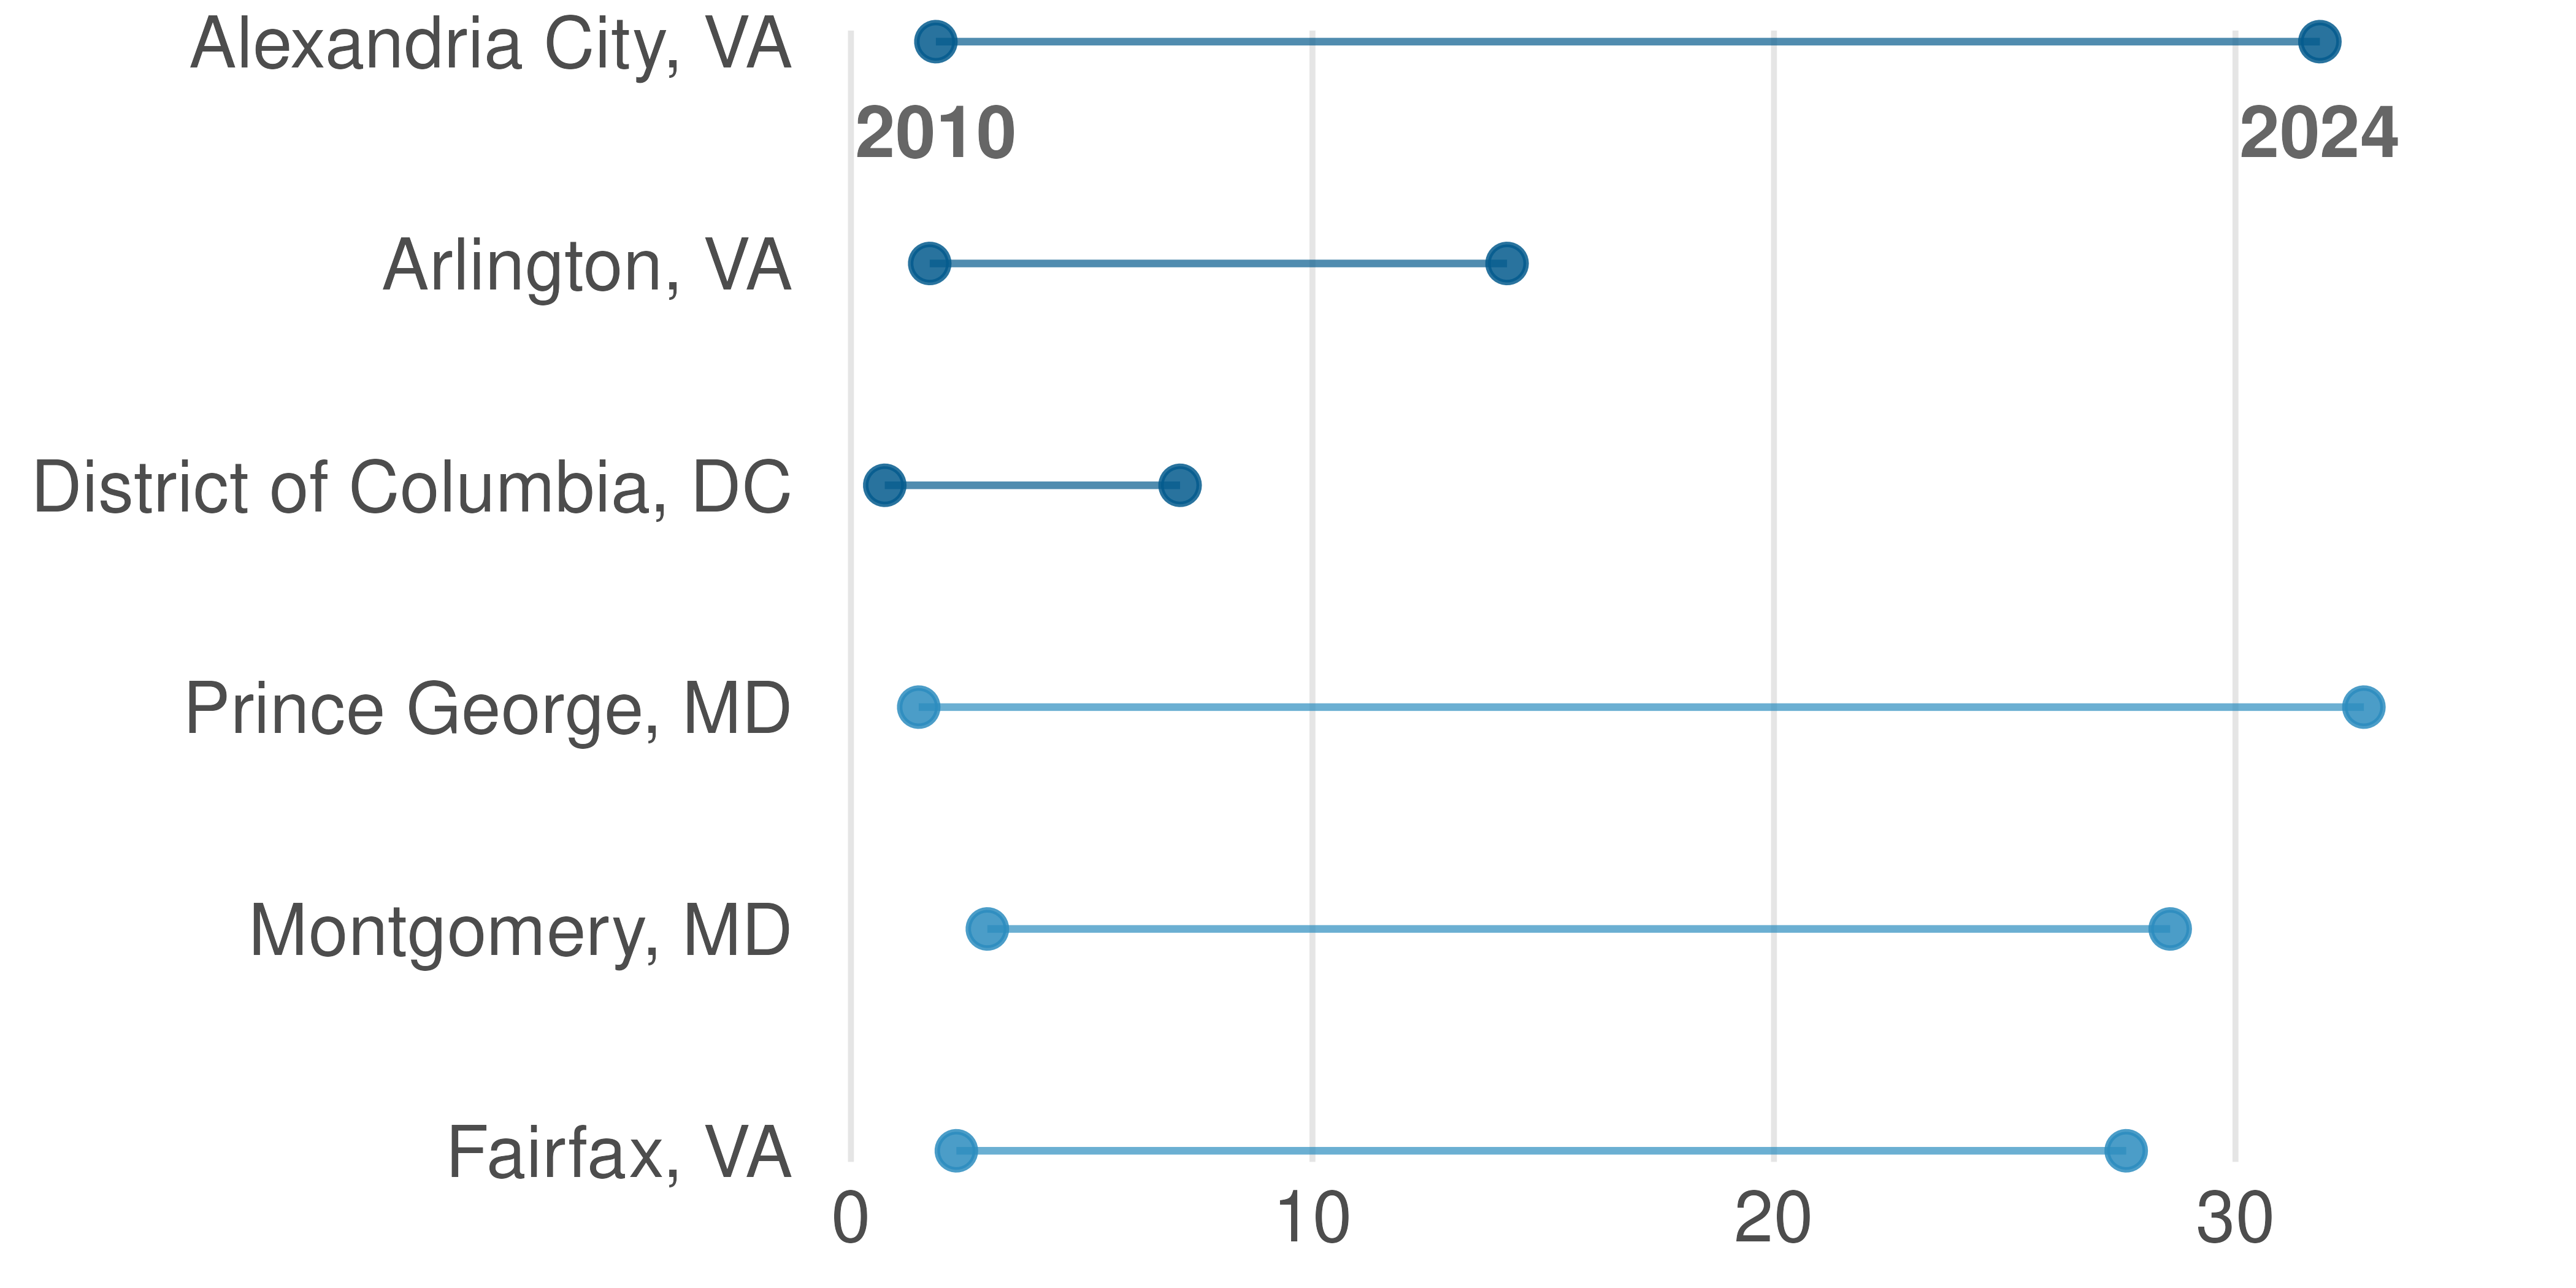
Before the enactment of this policy, the share of federal workers working at home had increased from 2010 to 2024. Figure 2.3 shows the share of federal workers who worked at home in 2010 and 2024 (we show just the larger jurisdictions for which we can calculate these figures). The increase held across all jurisdictions. The City of Alexandria stands out, with the number of workers who work at home increased from fewer than 1 in 20 to almost 1 in 3.
Figure 2.3: Federal Workers Substantially More Likely to Work at Home in 2024
Share of federal workers who work from home, 2010 vs 2024
Source: ACS Table B08528: Means of Transportation to Work by Class of Worker Notes: Answered with “Worked from Home” divided by Total Federal Workers.
It is possible that the return of these workers to central cities may blunt some of the impact of the federal job cuts in the most central jurisdictions. That said, the net impact of the return to office in combination with federal job cuts remains unclear.