State of the Capital Region 2022
SOCR 2022: Commuting Patterns and Transportation Infrastructure
| Authors | Affliation |
|---|---|
| Jaclene Begley | Center for Washington Area Studies |
| Leah Brooks | Center for Washington Area Studies & Trachtenberg School of Public Policy and Public Administration, The George Washington University |
| Brian J. McCabe | Georgetown University |
| Jenny Schuetz | Brookings Institution |
| Stan Veuger | American Enterprise Institute |
With assistance from:
| With assistance from: | Affilation |
|---|---|
| Kaitlin Fagan | The George Washington University |
| Kenan Dogan | Georgetown University |
We appreciate support for this report from advisory council member JBG Smith.
This report is a collaborative effort from researchers at the American Enterprise Institute, Brookings Institution, Georgetown University and the George Washington University. We are particularly grateful to the Trachtenberg School of Public Policy and Public Administration and the George Washington Institute for Public Policy for their support in reinvigorating the Center for Washington Area Studies over the past four years.
Introduction
One of the key policy challenges in urban areas is how to facilitate people moving across space: commuting between home and work, running errands, shopping, and socializing. Traveling between places consumes a substantial portion of people’s daily time and budget. The transportation sector is responsible for the largest share of greenhouse gas emissions. Well-functioning transportation systems allow people and goods to move across space safely and efficiently; poorly-designed transportation systems create noise, pollution, crashes, and frustration.
This year’s State of the Capital Region report focuses on transportation patterns, connecting the themes of previous reports on the geography of new housing (2019) and the spatial patterns of employment (2021). Chapter 1 describes trends over time in how people move between home and work. Chapter 2 focuses on public transportation in the Capital Region and places it in a national context. The third and final chapter investigates major financial investments in transportation projects throughout the region.
Among the striking facts that emerge from our analysis is the remarkable consistency over the past 50 years in the way Capital Region commuters get to work. Roughly 80 percent drive in cars, either solo or as part of a carpool. Public transportation accounts for almost 15 percent of commuting, and this share has only seen small fluctuations over this time period, despite the ongoing expansion of the Washington Metropolitan Area Transit Authority’s (WMATA) Metrorail system. While the region has seen a slight uptick in the share of workers with no commute (because people work from home) and a slight decline in walking commutes, both of these modes account for a minimal share of overall commute patterns.
Figure 0.1: Mode Choice in Commuting to Work Is Constant Over Time
Percent of Capital Region commuters by transportation mode, 1970-2019
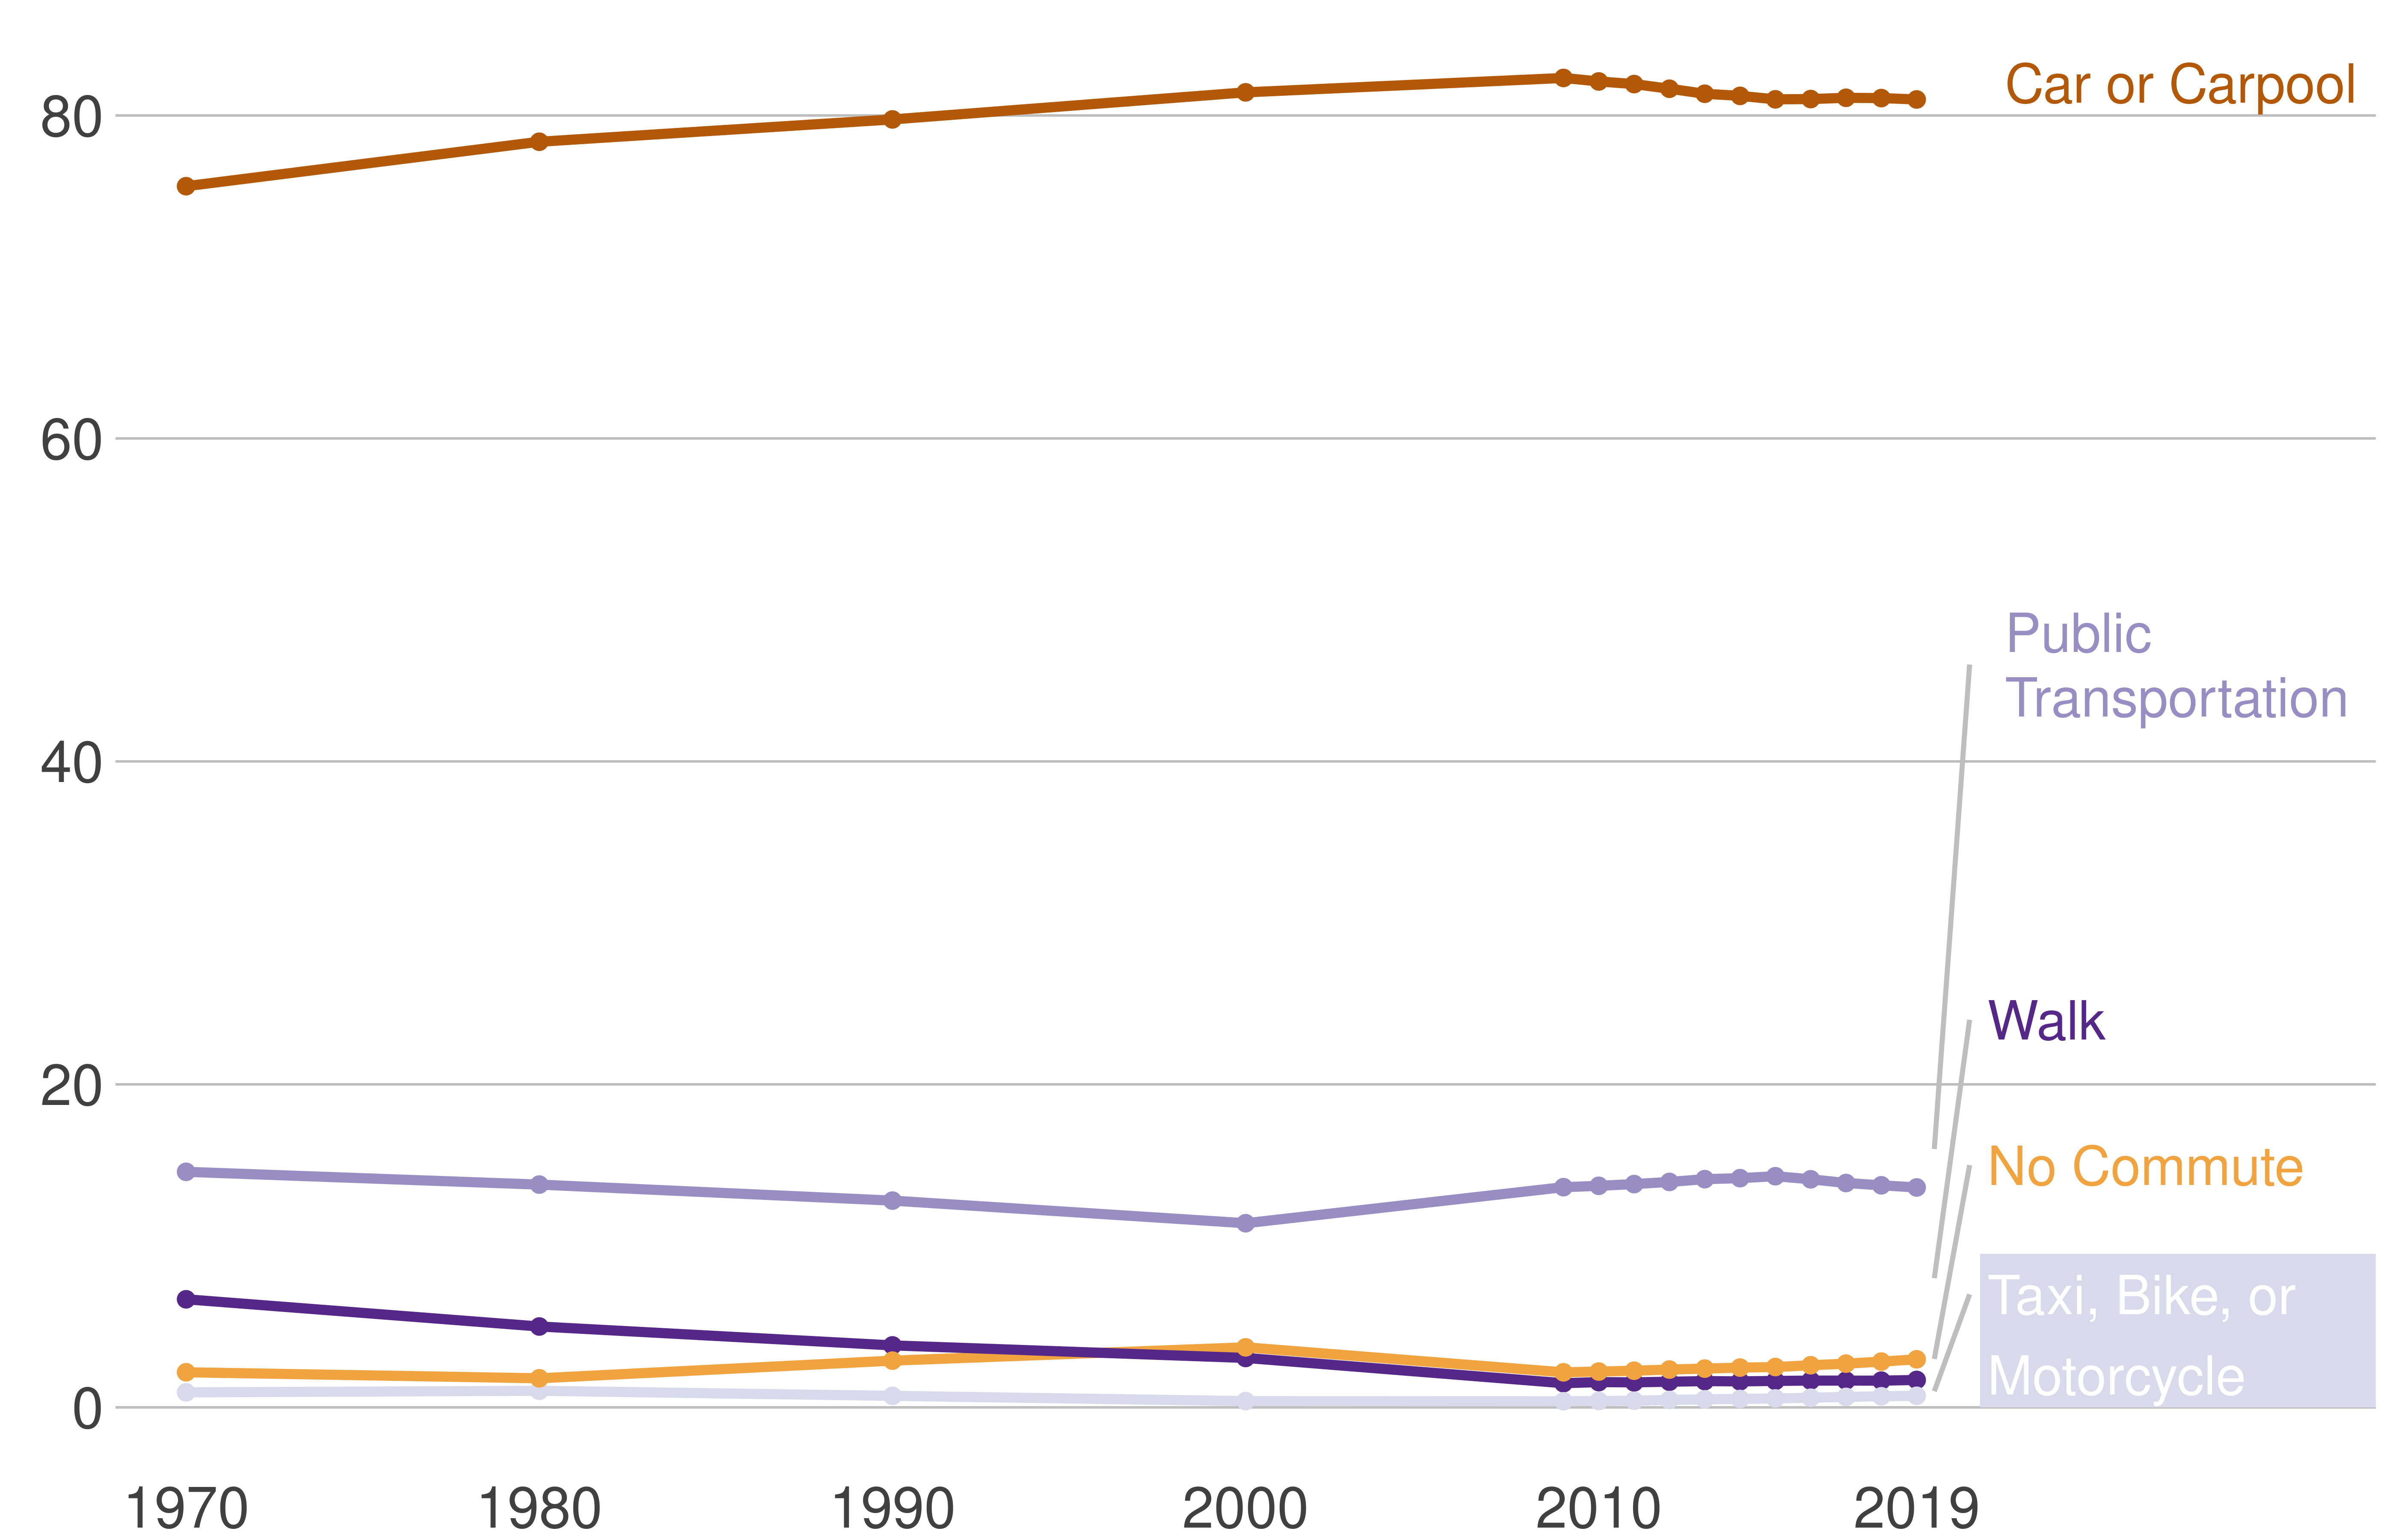
Source: Census, 1970-2010; American Community Survey, five-year estimates 2009 (2005-2009) to 2019 (2015-2019).
While mode choice in commuting to work remains constant, overall ridership on the region’s Metrorail and Metrobus has been declining since 2010. Ridership peaked around 350 million annual trips in 2012 before declining to about 300 million annual trips in 2016–2018. Ridership tumbled precipitously in 2020 and 2021 when the COVID-19 pandemic hit.
Figure 0.2: WMATA Ridership Has Been Declining Since 2010
Millions of annual trips on WMATA services, 2005-2021
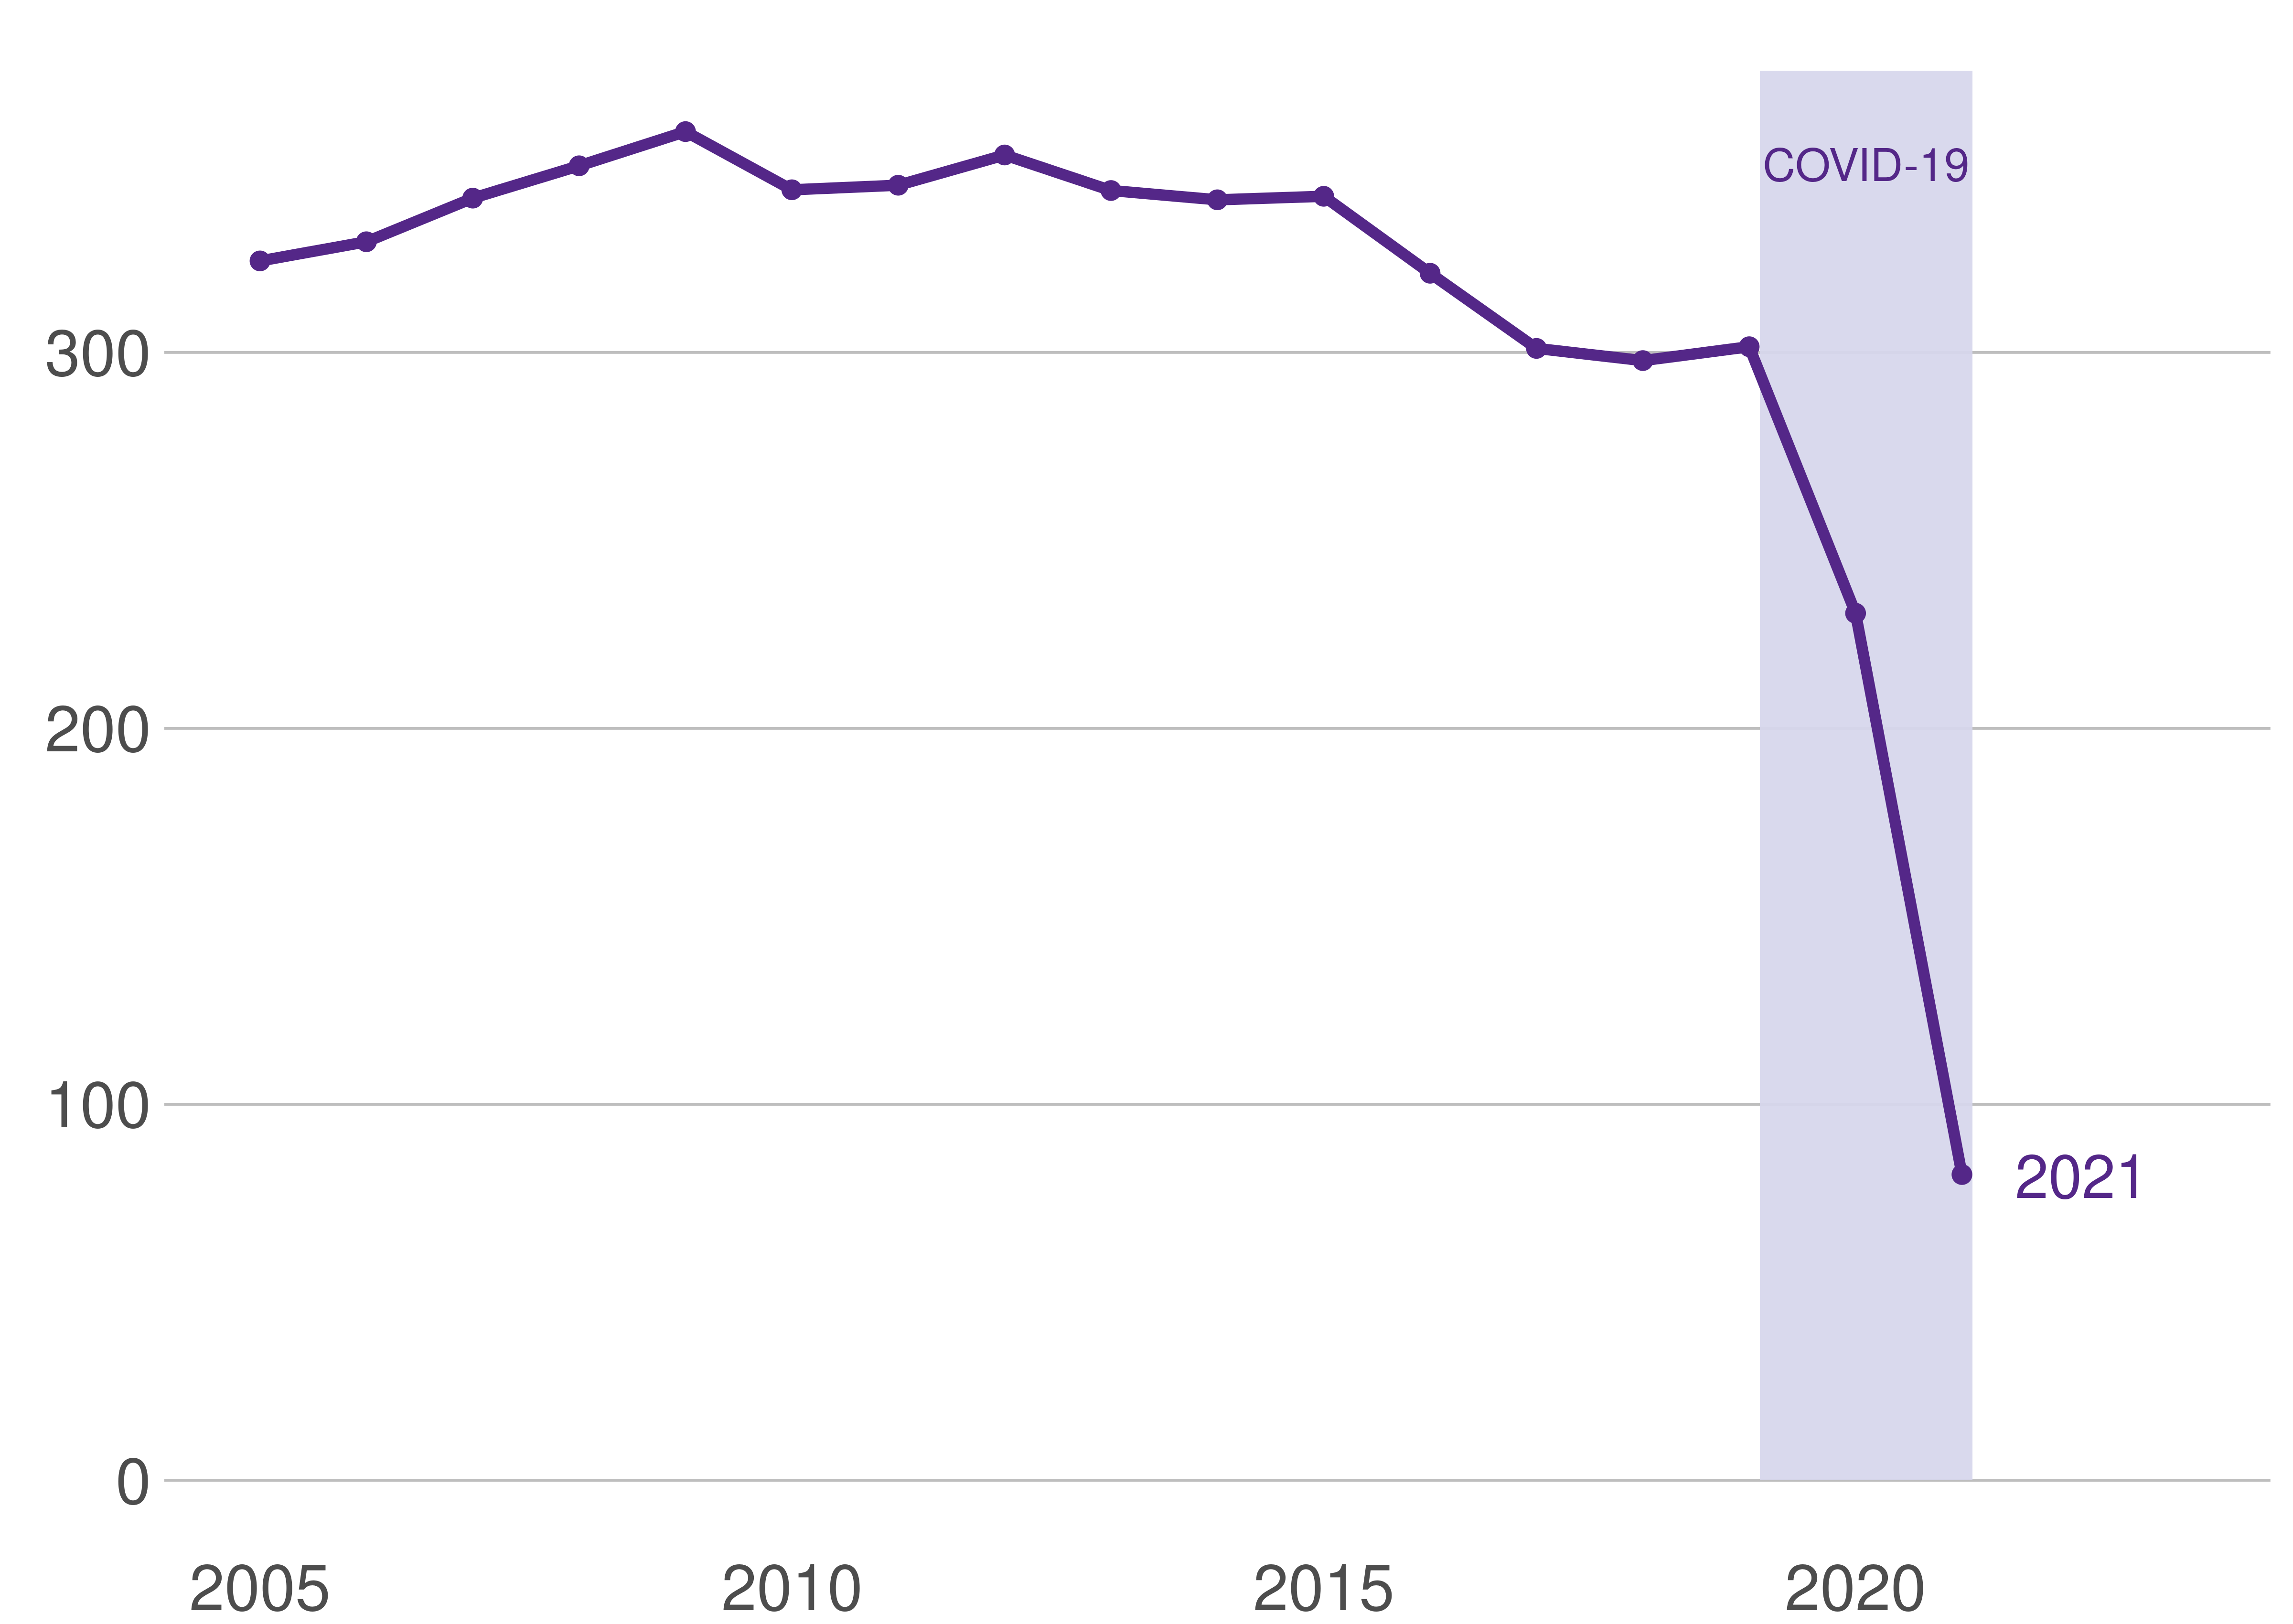
Source: Washington Metropolitan Transit Agency annual reports, 2006-2021. See appendix for complete source.
As we discuss in more detail in Chapter 2, declining ridership reflects broader economic trends as well as factors within WMATA’s control, such as service quality. As we showed in our 2019 report, two-thirds of new housing added since 1980 has been built in exurban counties that are beyond the reach of the existing Metrorail and Metrobus systems. To contextualize the region, we show the counties and cities that make up the Capital Region in Figure 1.3. Urban jurisdictions are dark blue, suburban jurisdictions are light blue, and exurban jurisdictions are green.
Figure 0.3: Urban, Suburban, and Exurban Jurisdictions in the Capital Region
Capital Region jurisdictions
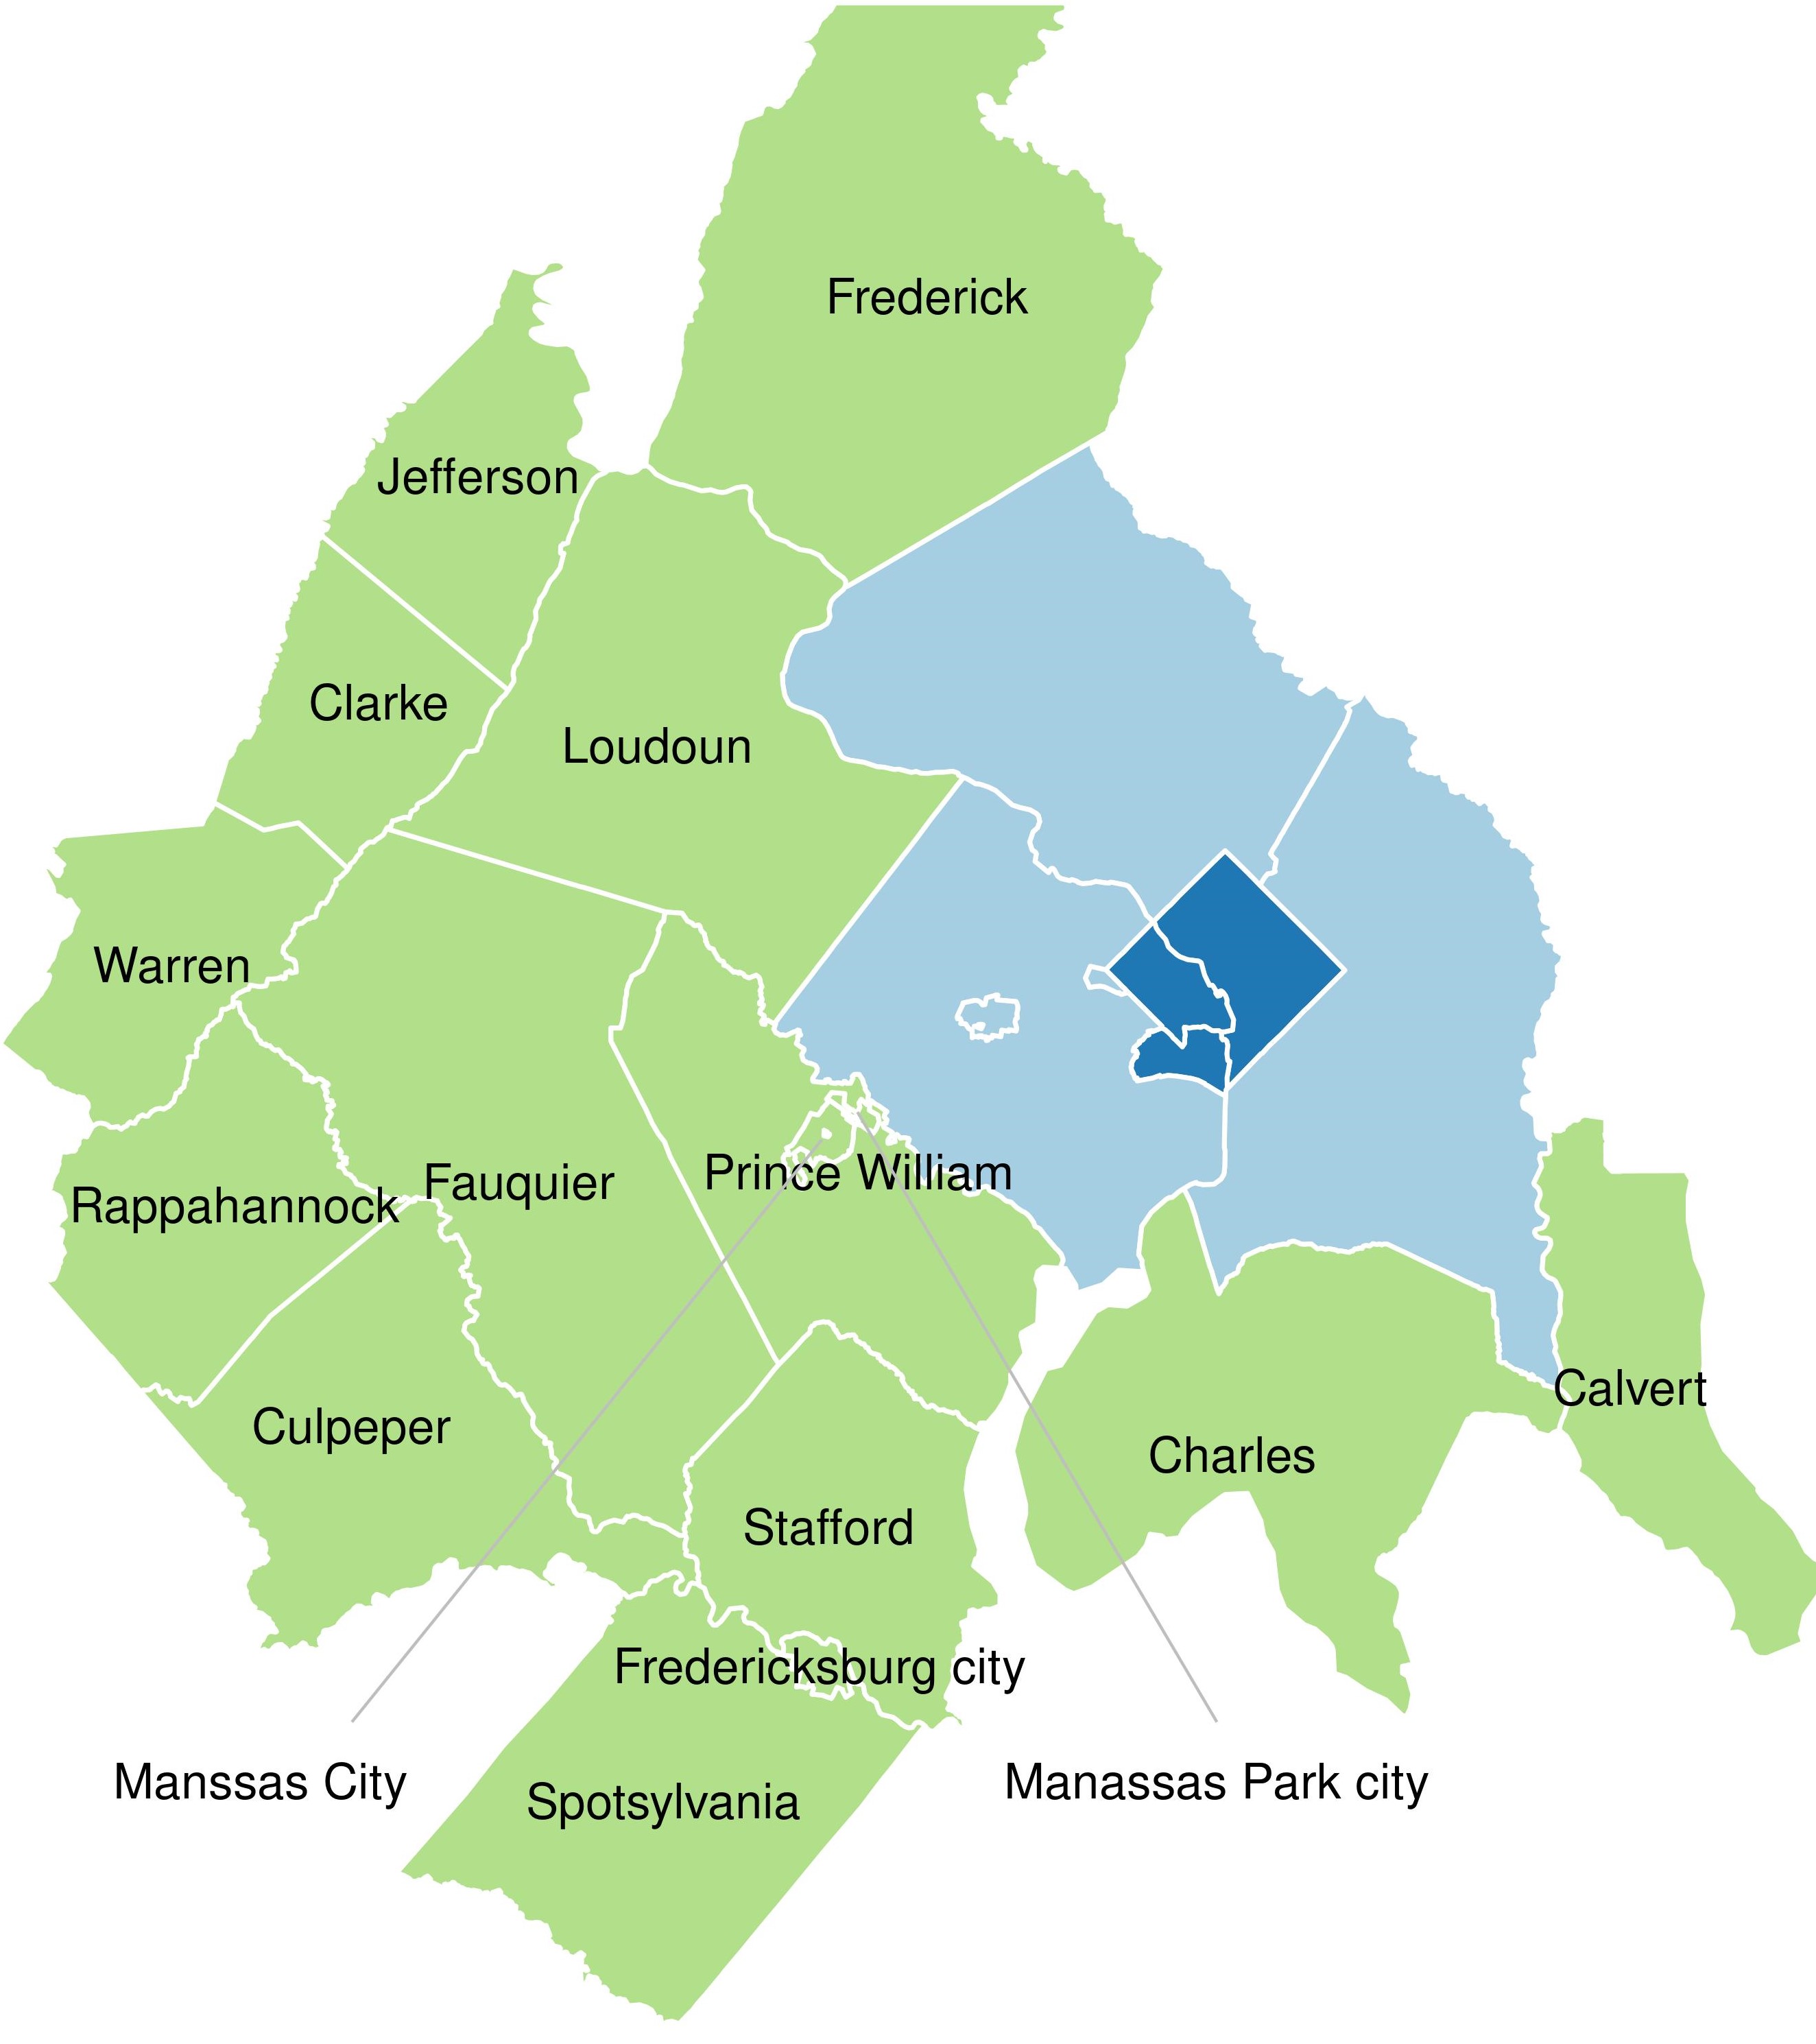
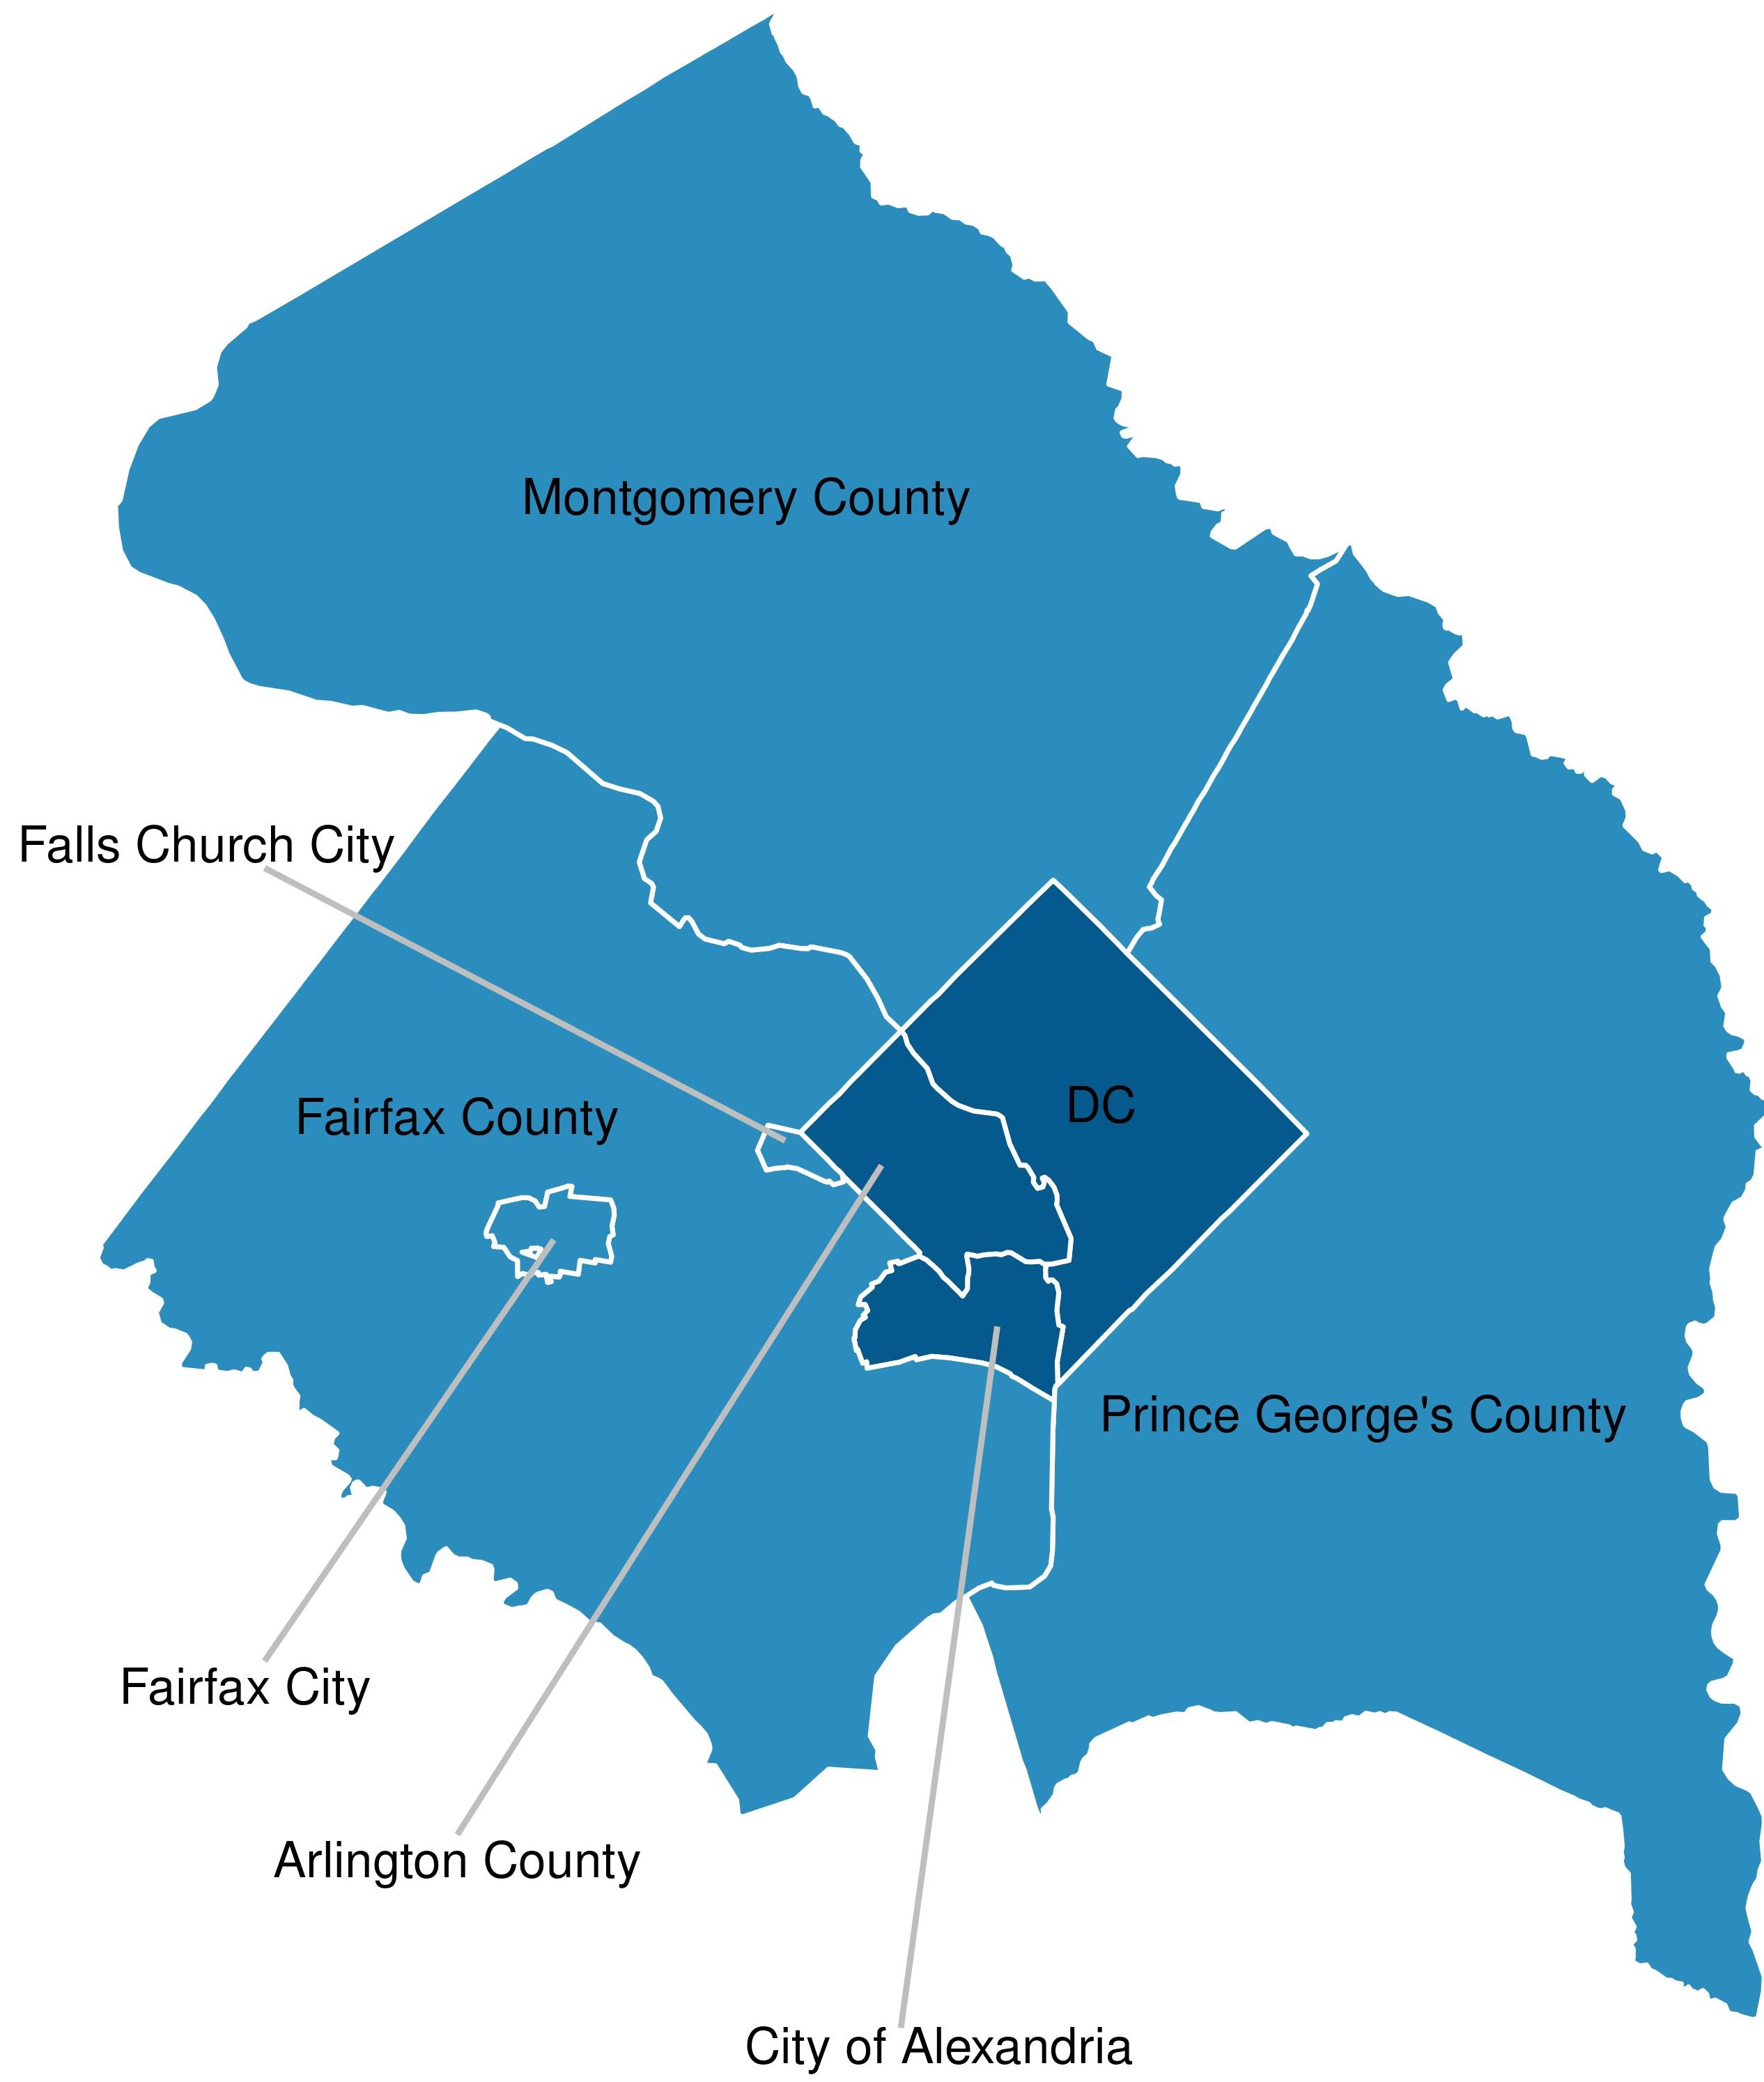
Source: Census Bureau, 2010 jurisdictional boundaries.
As the region’s economy continues to recover from two years of extraordinary disruption, policymakers face several important questions about the future of transportation in the Capital Region. How many workers–especially in government and professional services—will continue to telework at least part time? What impact will this expanded teleworking have on ridership and revenues for the public transportation system? Will traffic crashes remain elevated? Can the Biden Administration’s ambitious climate policies affect the region’s heavy dependence on cars? Policymakers have a variety of tools that could alter household travel behaviors to make the region safer and cleaner, if they choose to do so. We hope that this report gives policymakers perspective to make policy that improves the lives of commuters throughout the region.