2 Chapter 2: Public Transportation
As we saw in the introduction, cars have been the primary mode of transportation for commuters in the Capital Region for well over half a century. At the same time, public transportation is of significantly more importance here than in other major urban areas.
Figure 2.1 shows that over the past 20 years, ridership per capita in the Capital Region has fluctuated around 100 rides per resident. This figure includes not just WMATA bus and rail, but also commuter buses, local buses, and all commuter rail. This total is well below the New York urban area, where the same metric has exceeded 200 since 2005, but it is higher than ridership in other major urban areas around the country.3 While Boston, Chicago, and Philadelphia come reasonably close, commuters in the Capital Region are dramatically more likely to rely on public transportation than commuters in Dallas, Detroit, Houston, Los Angeles, and Miami.
Figure 2.1: Among Major Urban Areas, the Capital Region Is Second Only to New York in Its Reliance on Public Transportation
Millions of individual passenger trips per capita in the 10 most populous urbanized areas, 2002-2019
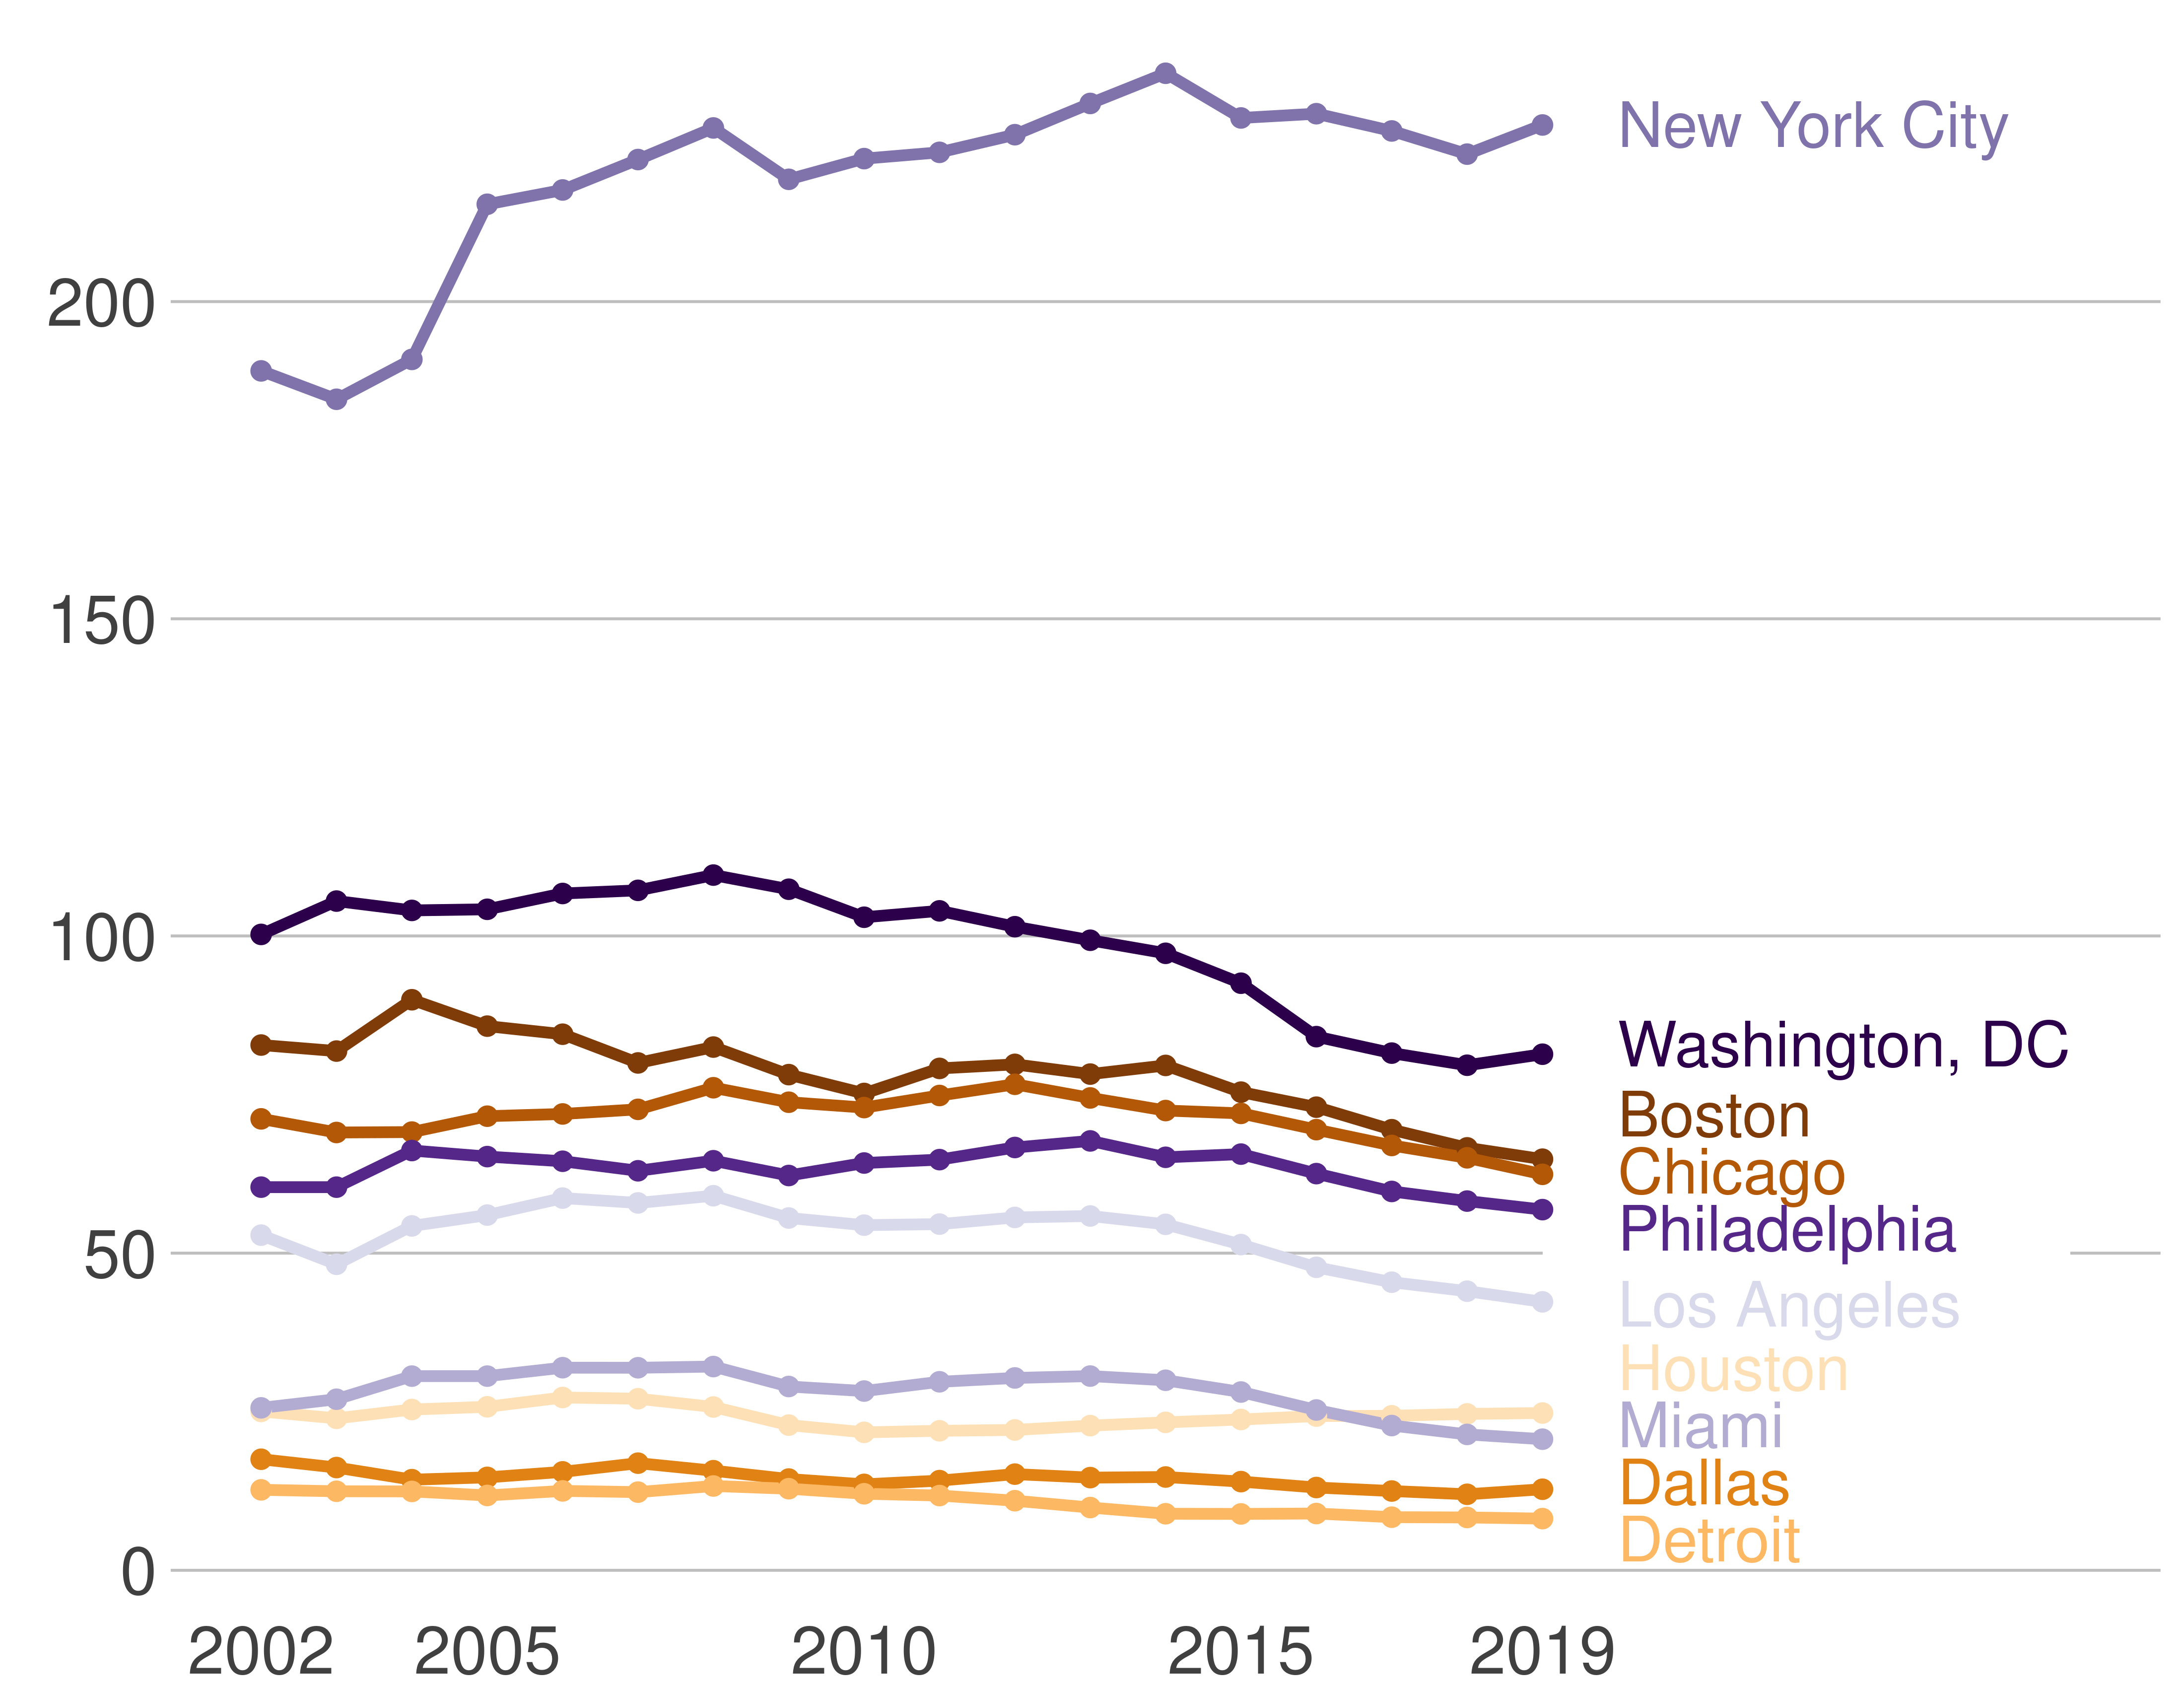
Source: National Transit Database, 2002-2019. Notes: The National Transit database reports data by urbanized area, which has a different definition than metropolitan statistical area, by which the remainder of the report defines the Capital Region. This is the total of all transit agencies in each urbanized area reporting to the national transit database.
This state of affairs is of course not a given. Ridership per capita in the Capital Region relative to other major urban areas has been relatively stable since the start of the century, but that picture of broad stability masks a significant recent decline in absolute numbers per capita. As Figure 2.2 highlights, ridership per capita has declined meaningfully in most large urban areas, and the Capital Region is no exception. Ridership declined by 20 percent between 2002 and 2020, a reduction that materialized in its entirety in the years since 2010.
Figure 2.2: Public Transportation Ridership in the Capital Region Has Declined by Over 20 Percent Since 2010
Change in public transit ridership per capita in 10 largest urbanized areas relative to 2002, 2002-2019
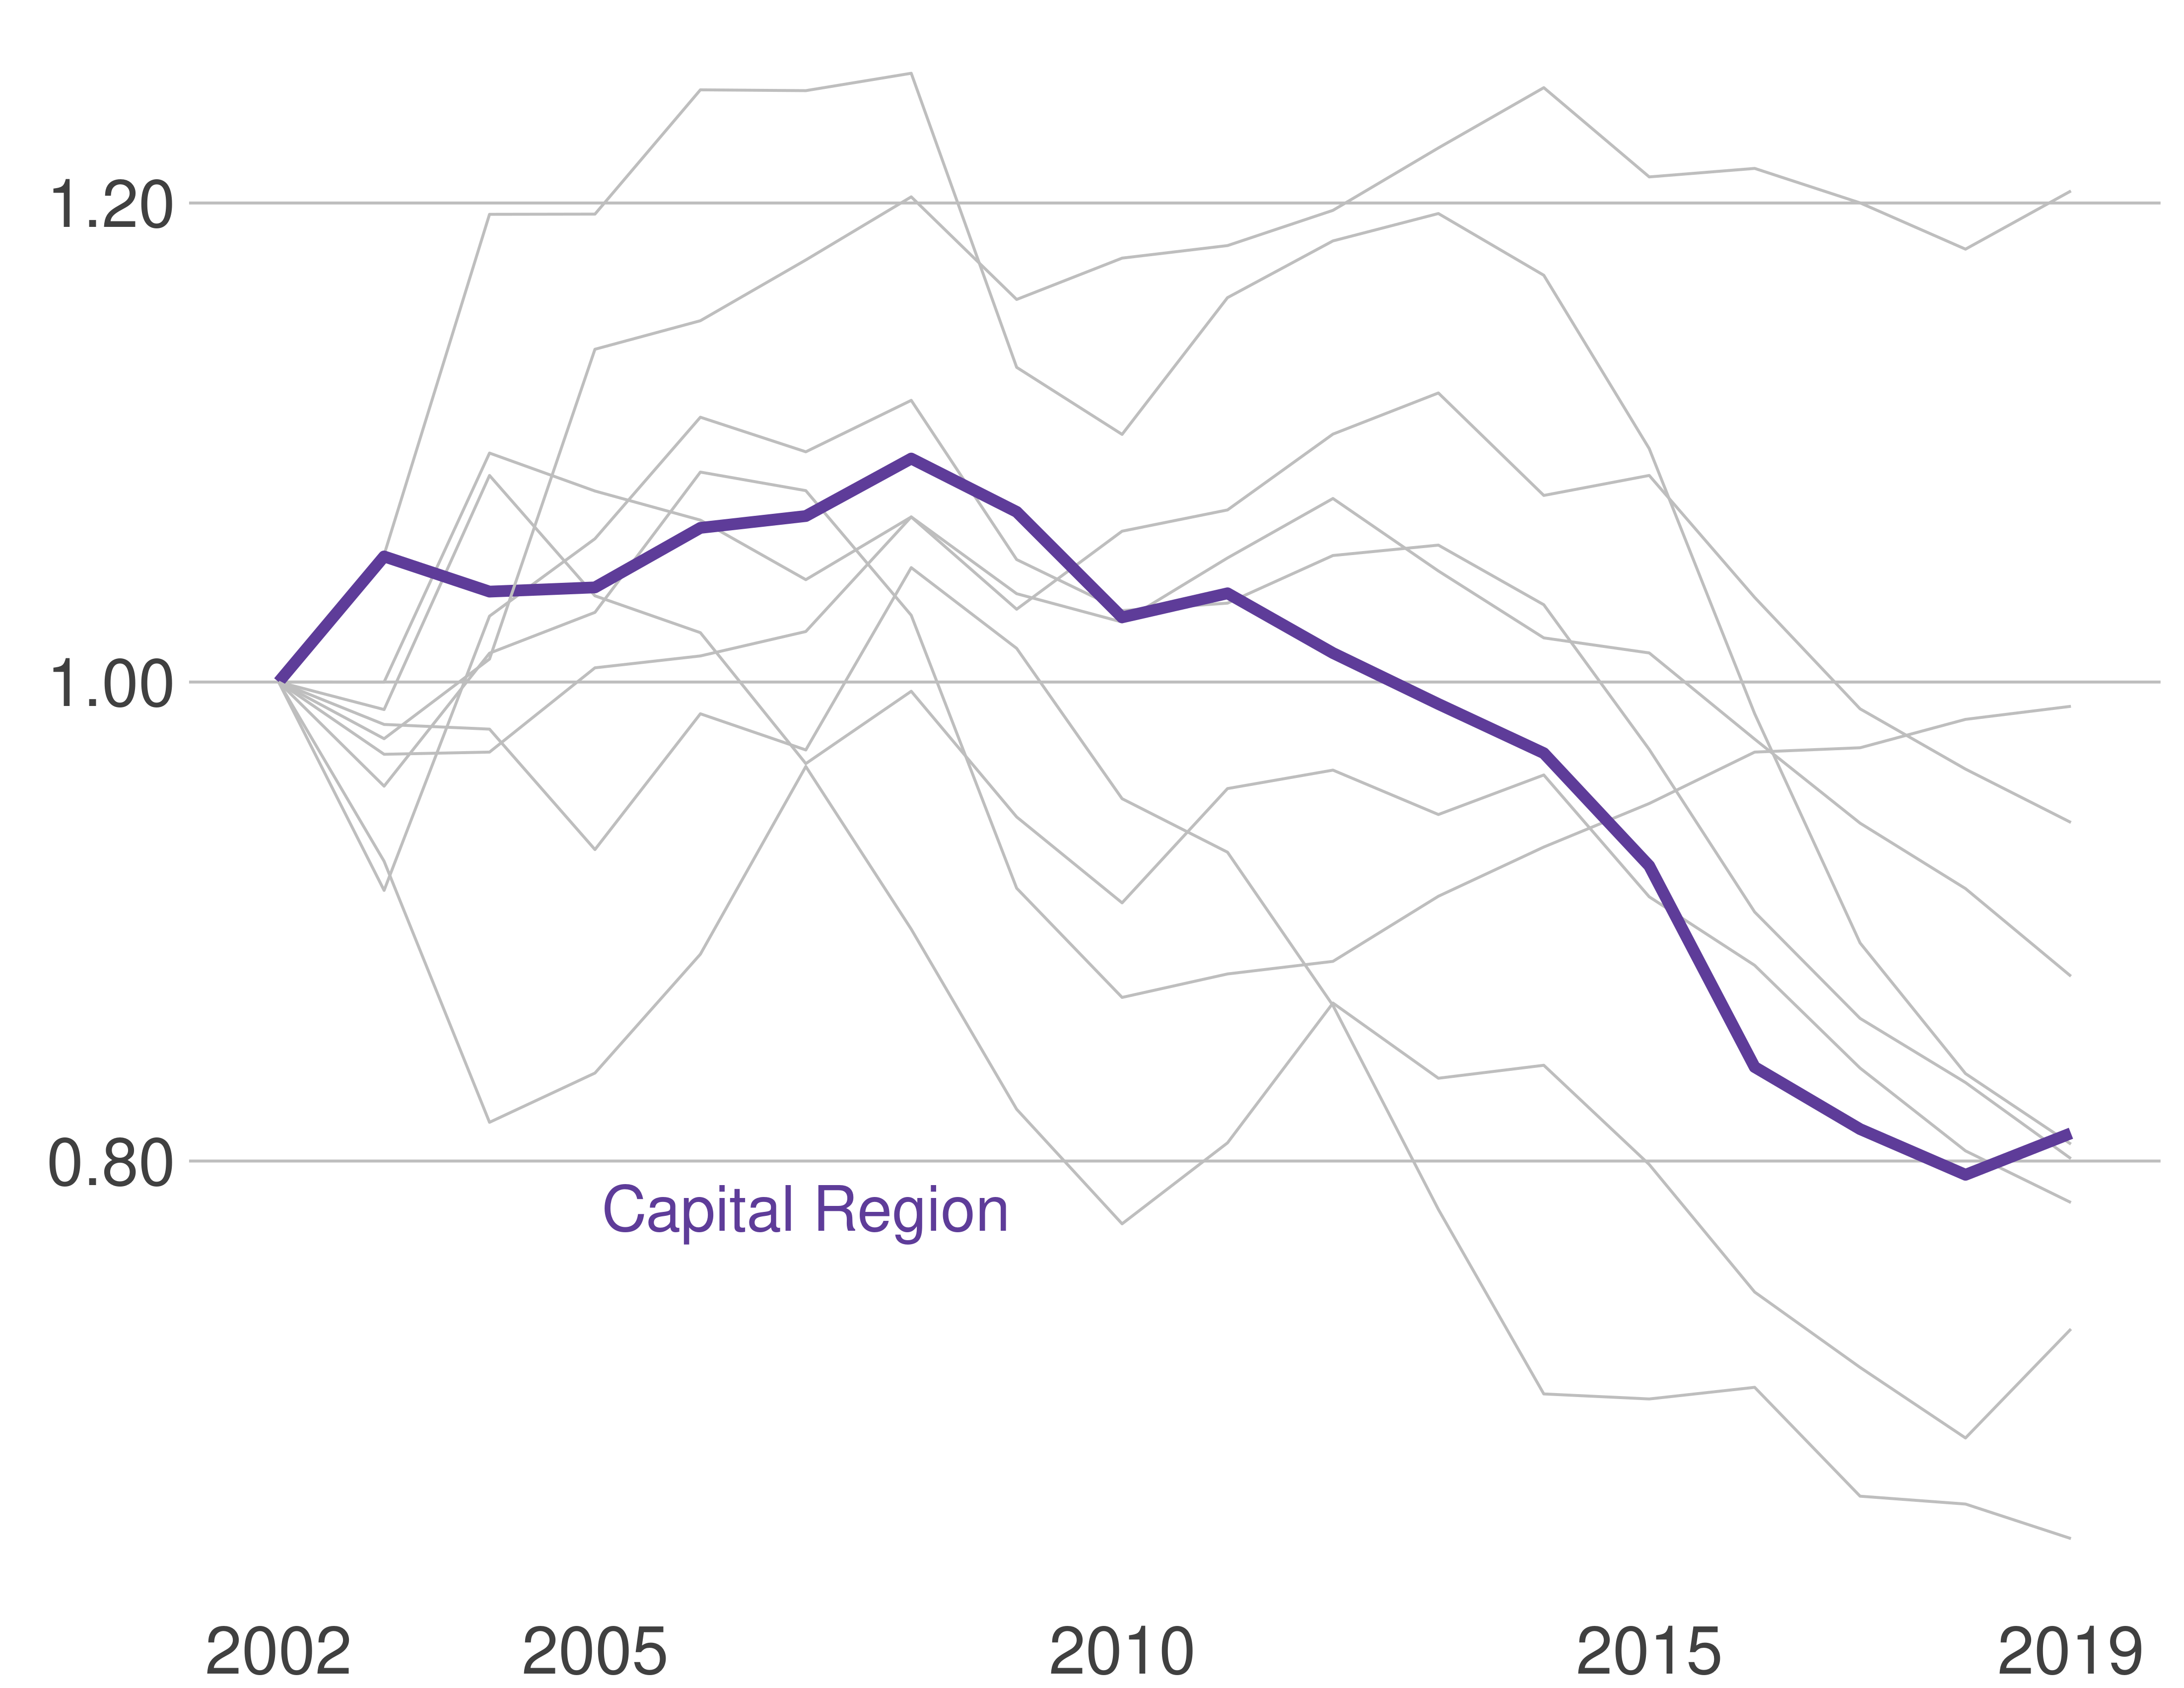
Source: National Transit Database, 2002-2019. Notes: The National Transit database reports data by urbanized area, which has a different definition than metropolitan statistical area, by which the remainder of the report defines the Capital Region. This is the total of all transit agencies in each urbanized area reporting to the national transit database.
Not all residents of the Capital Region rely on the public transportation network to the same extent. Figure 2.3 shows that usage patterns correspond roughly to patterns of population density, as one might expect. In urban jurisdictions, around one-third of commuters take public transportation. That share is dramatically lower in suburban jurisdictions, where, despite a doubling over the past 50 years, still just under 15 percent of commuters use the bus or rail to get to work. It is even lower in exurban jurisdictions, where it has remained below five percent despite a slight increase in the past 30 or so years.
Figure 2.3: Urban Commuters Continue to Use Public Transit Most
Percent of commuters riding public transit by area type of residence, 1970-2019
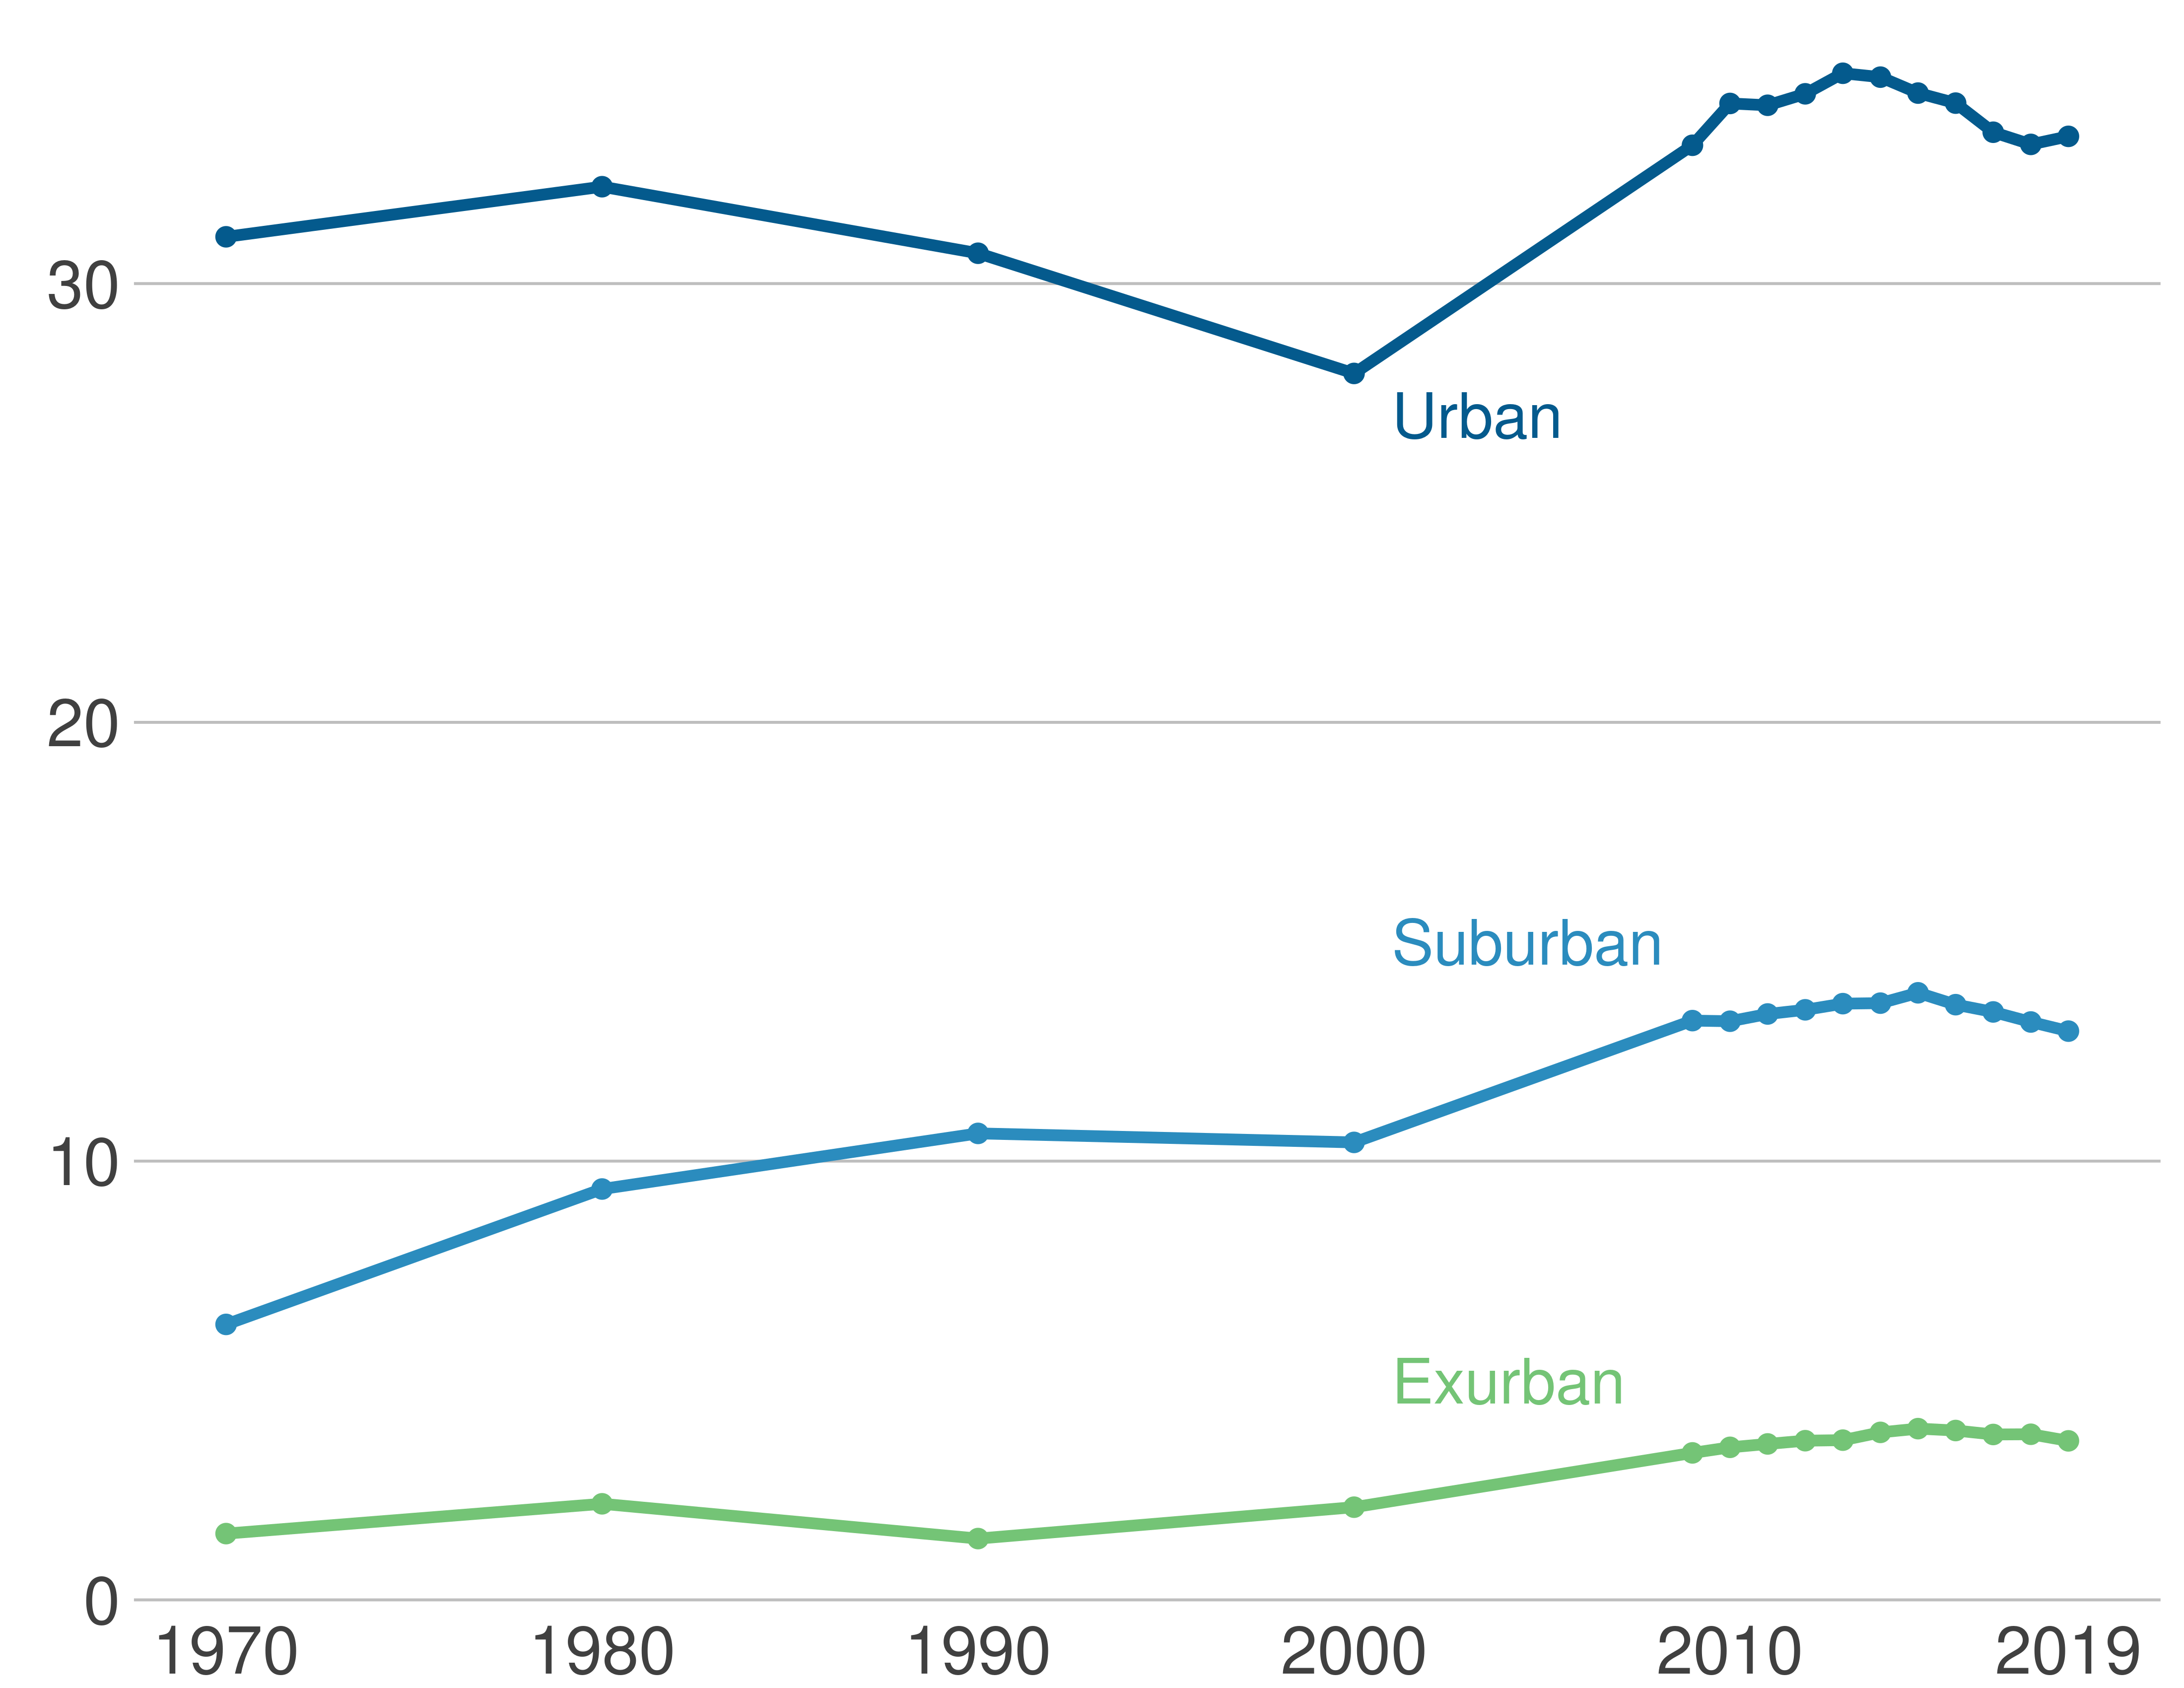
Source: Census, 1970-2010; American Community Survey, five-year estimates 2009 (2005-2009) to 2019 (2015-2019). Notes: This data is self-reported transportation mode choice from the Census.
It is important to keep in mind that these usage patterns do not directly translate into passenger volumes. While urban commuters are three times as likely to rely on public transit as suburban commuters, there are roughly three times as many suburban commuters overall. Figure 2.4 shows the implication of those facts for the share of commuters by type of jurisdiction: there are about as many urban commuters who use public transit as there are suburban ones. This is a dramatic change from half a century ago, when urban commuters accounted for over 75 percent of public transit usage. As the region’s population has suburbanized, so has the user base of its public transportation systems. While the share of exurban commuters has grown rapidly as well, it started from a much lower base and is still much smaller than that of their urban and suburban counterparts.
Figure 2.4: Urban Commuters No Longer Constitute a Majority of Capital Region Public Transit Commuters
Share of public transit commuters by area type
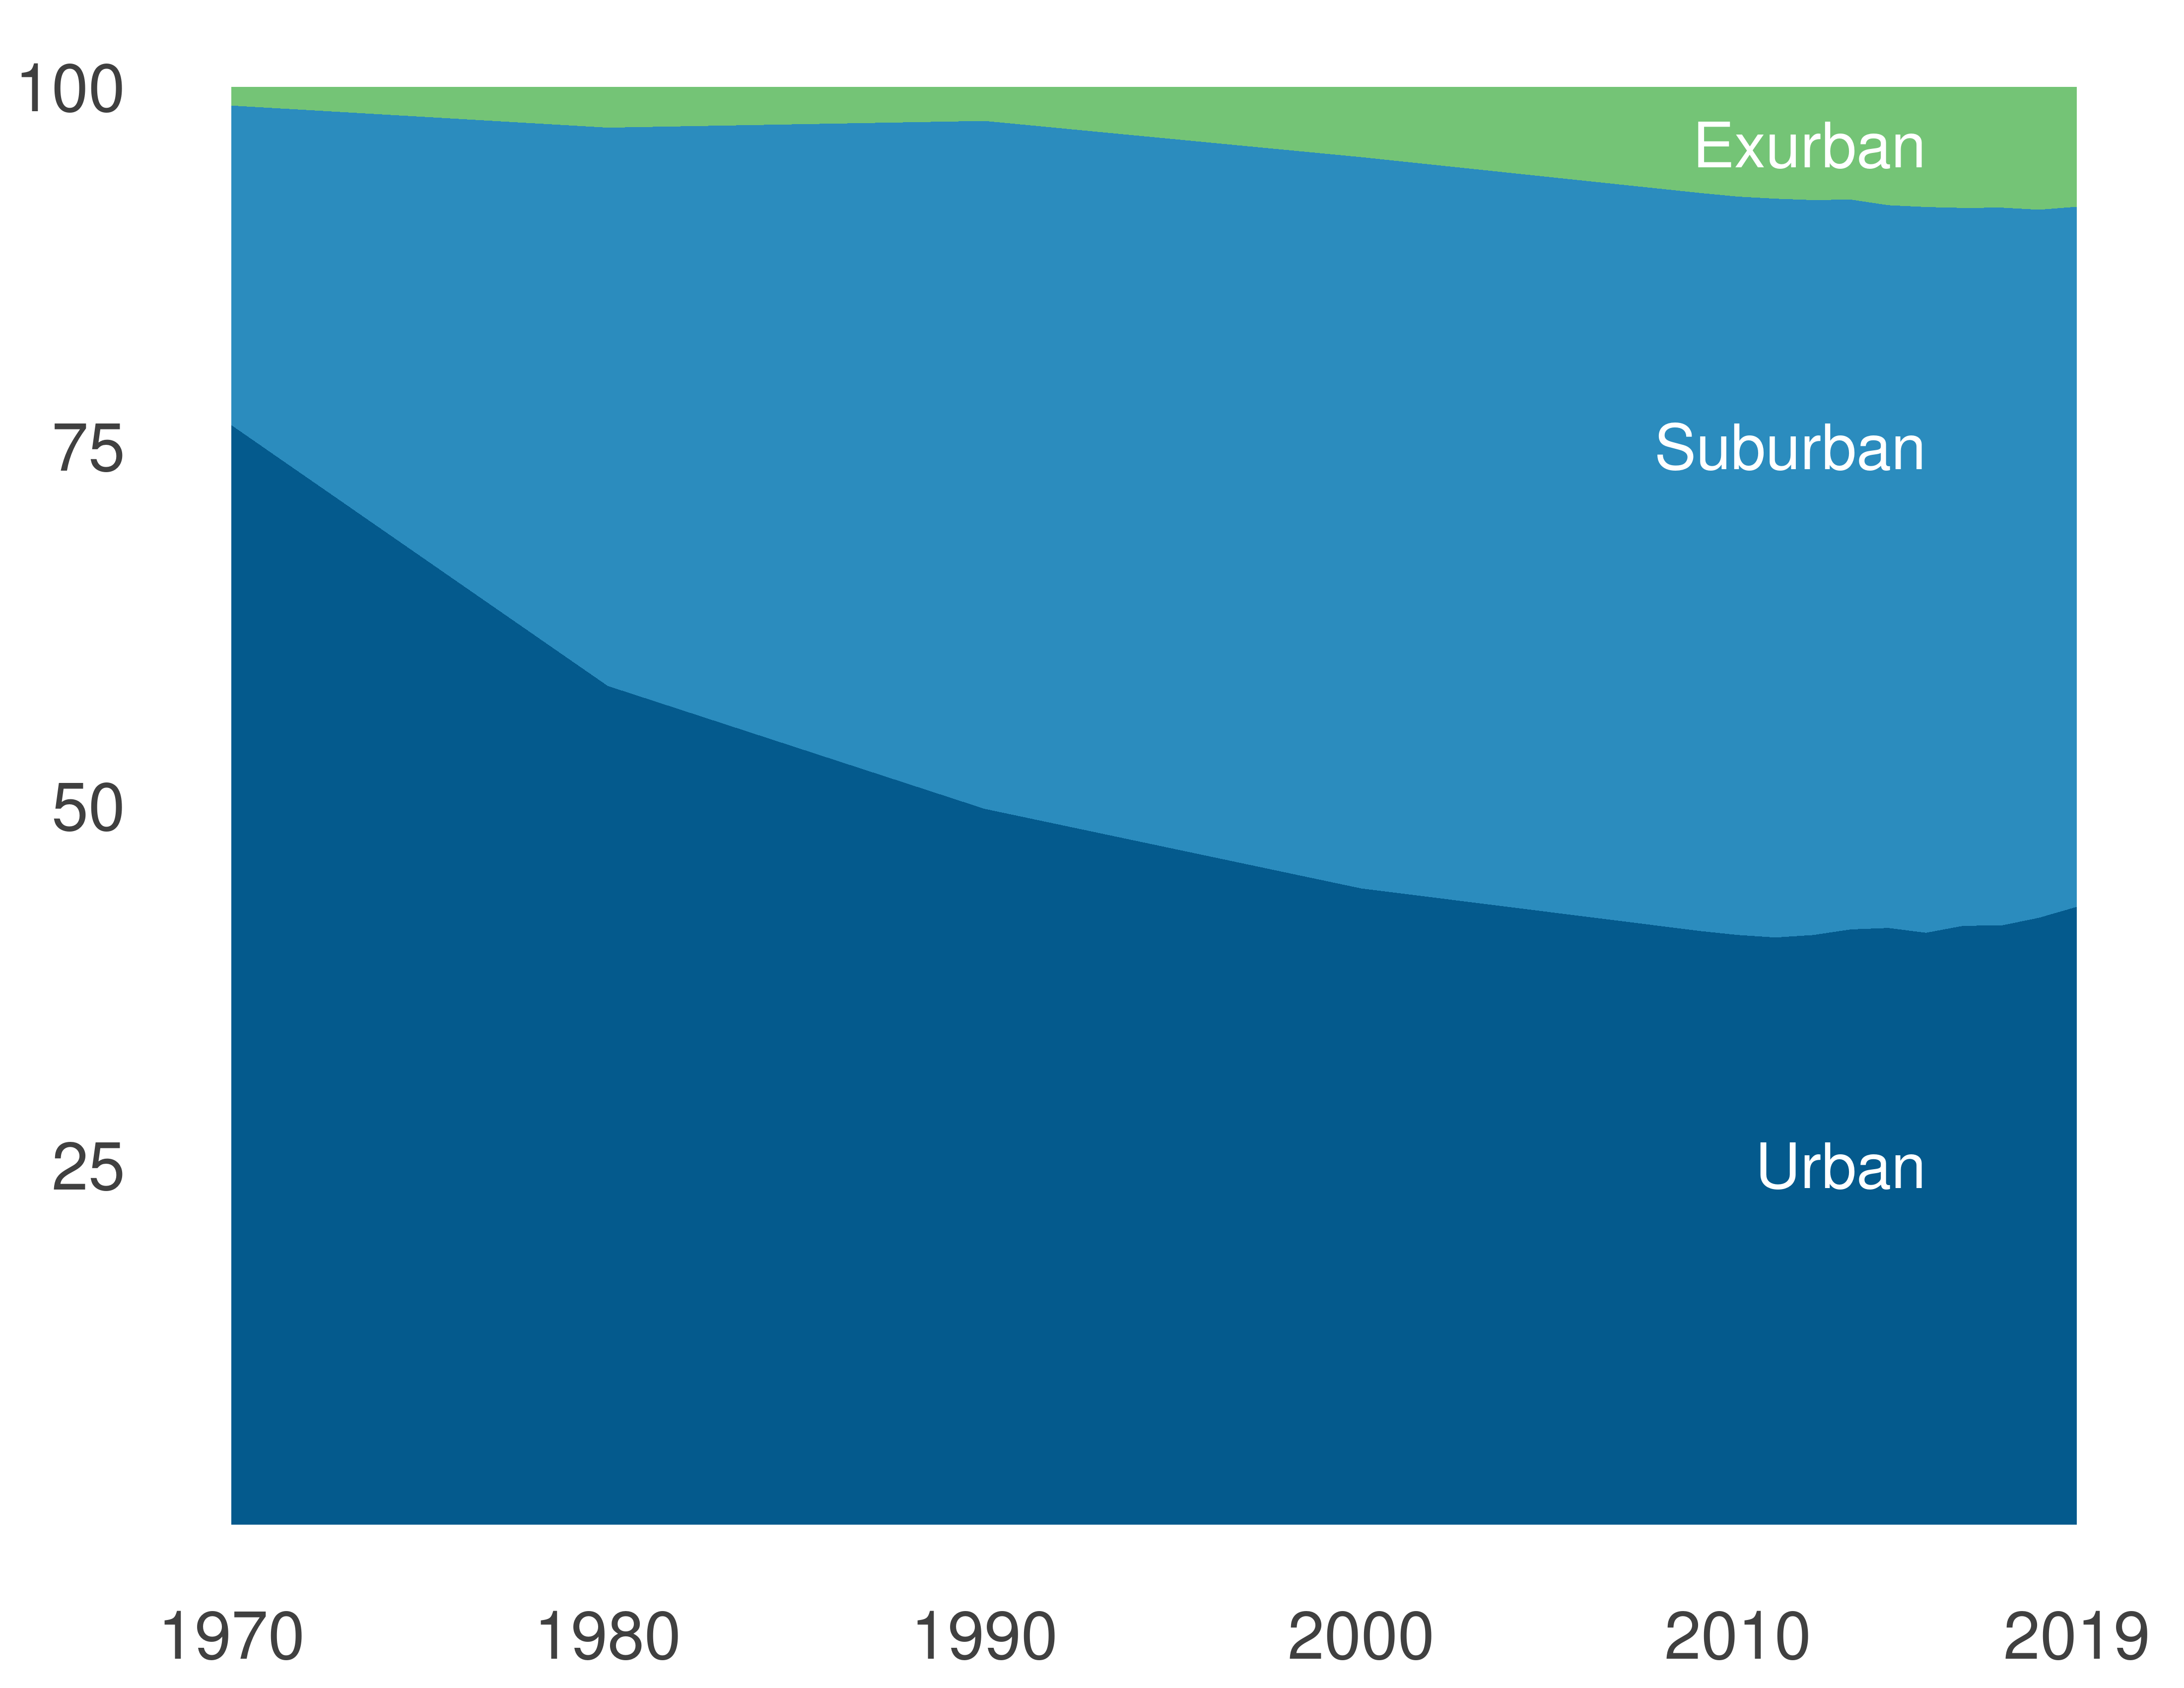
Source: Census, 1970-2010; American Community Survey, five-year estimates 2009 (2005-2009) to 2019 (2015-2019). Notes: This data is self-reported transportation mode choice from the Census.
Public Transit Suffers from COVID-19
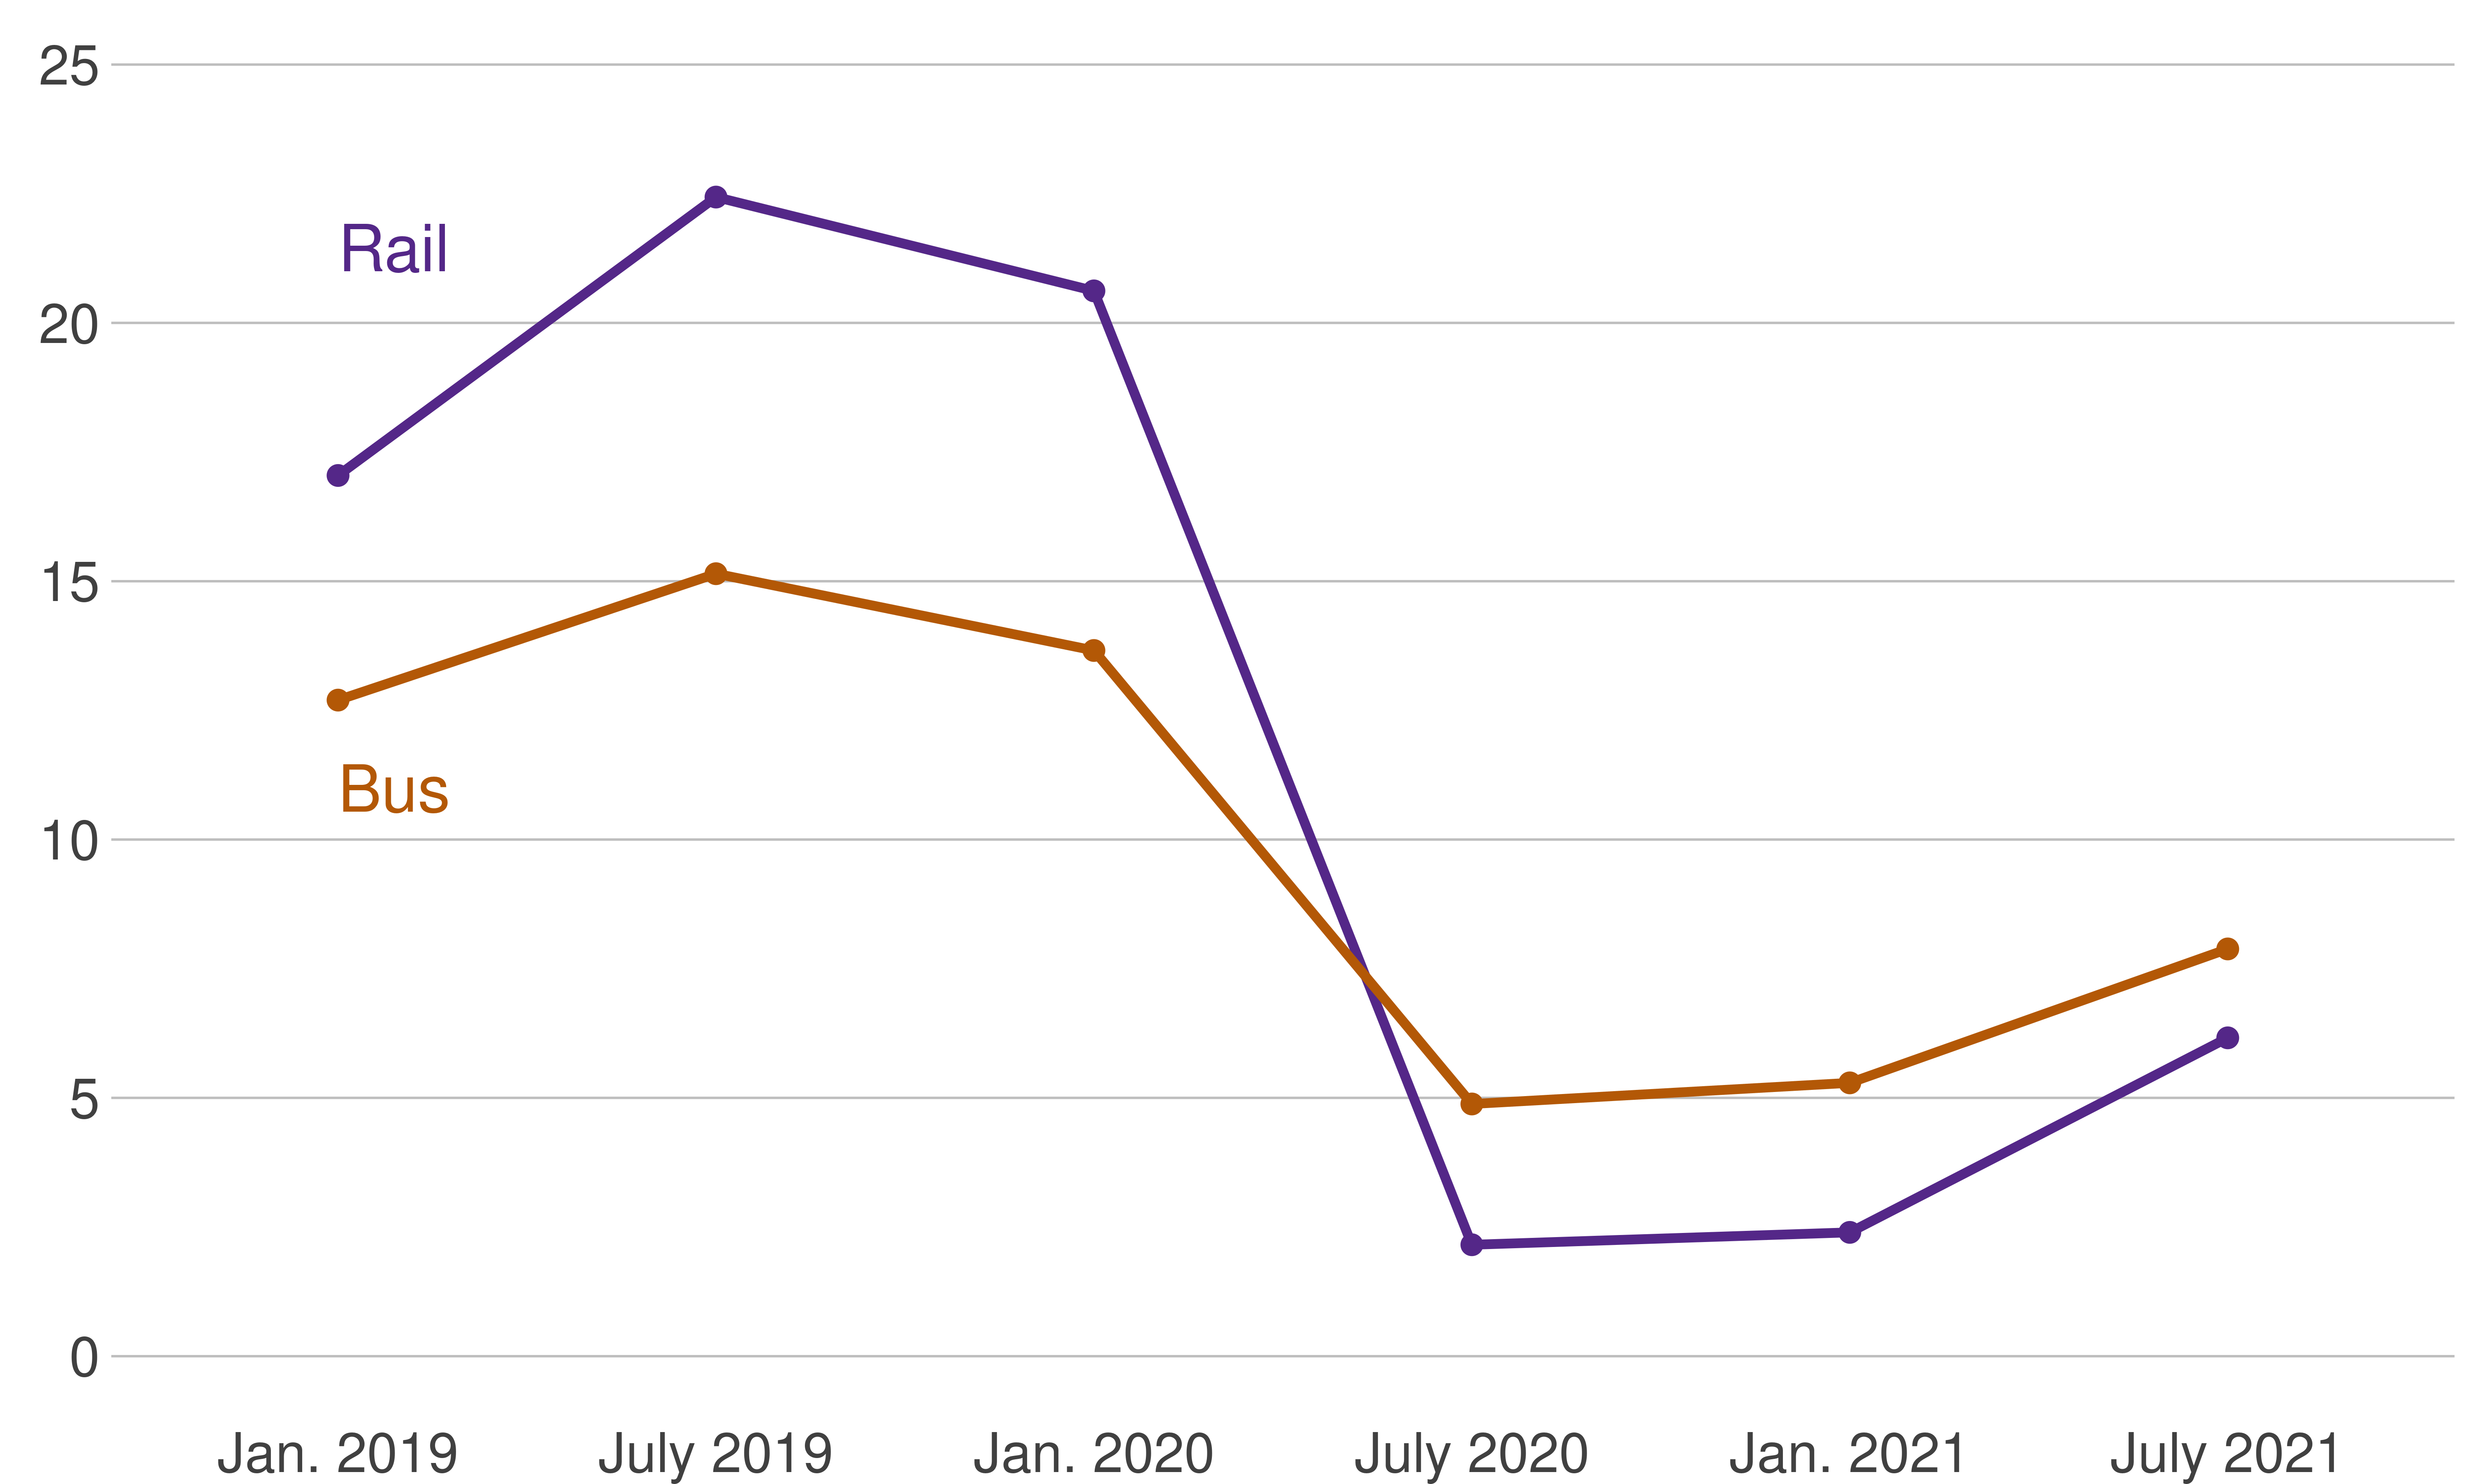
Our discussion in this chapter has focused on commuting patterns as they existed prior to March 2020. But the COVID-19 pandemic had a dramatic impact on all aspects of life in the Capital Region, and public transit is no exception. Travel by bus and by rail both dropped off dramatically in the second quarter of 2020. By July 2020, after the initial lockdowns had ended, rail travel remained down by 90 percent. Bus travel had fallen less, but even so was about two-thirds below January 2020 levels.
A year later, in July 2021, neither mode of transportation had even come close to recovering fully, as telework remained widespread. Most notably, the federal government, the region’s largest employer, largely continued to operate on a remote basis. The number of rides by rail was just over 25 percent of what it had been pre-pandemic, while the bus had lost about half of its riders.
Figure 2.5: Bus and Rail Ridership Have Not Recovered From the Pandemic Shock
Millions of total Capital Region monthly transit rides, January 2019 July 2021
Source: National Transit Database 2021.
Notes: Total unlinked rides. Includes Washington Metropolitan Area Transit Authority, Montgomery County, Maryland, City of Fairfax, Fairfax County, VA, Potomac and Rappahannock Transportation Commission, City of Alexandria, Virginia Railway Express, Arlington County, Virginia, Loudoun County, Prince George’s County, Maryland, Martz Group, National Coach Works of Virginia, DDOT - Progressive Transportation Services Administration, Maryland Transit Administration.
These data are for Census Urbanized Areas, which are defined differently than the metropolitan area definition that we use for the rest of the report.↩