3 Chapter 3: Where are we putting transportation monies?
While the previous chapters show the continued dominance of cars in the Capital Region and declining public transportation use, transit has occupied a growing share of local government expenditures over the past twenty years. At the same time, local governments have maintained a relatively constant share of highway spending.
We show how much money Capital Region governments spend on transportation in Figure 3.1, as a share of total expenditures. Over the last several decades, local jurisdictions have devoted significantly more money to public transportation than to highways. This comes as fewer and fewer residents are relying on public transportation to meet their travel needs, as noted in the previous chapter. Public transportation spending has climbed to nearly 10 percent of total expenditure in the region, while highway expenditures have remained relatively steady around 2.5 percent.
These costs do not, of course, reflect the full cost associated with these different modes of transportation. Both state and federal governments spend significant amounts of funds on highways in particular. In addition, these numbers do not take into account the alternative profitable uses of land that we are currently using for roads and parking spaces.
Figure 3.1: Local Jurisdictions Devote More Money to Public Transportation Than to Highways
Local government transportation expenditures by as a percentage of all local government expenditures, 1967-2016
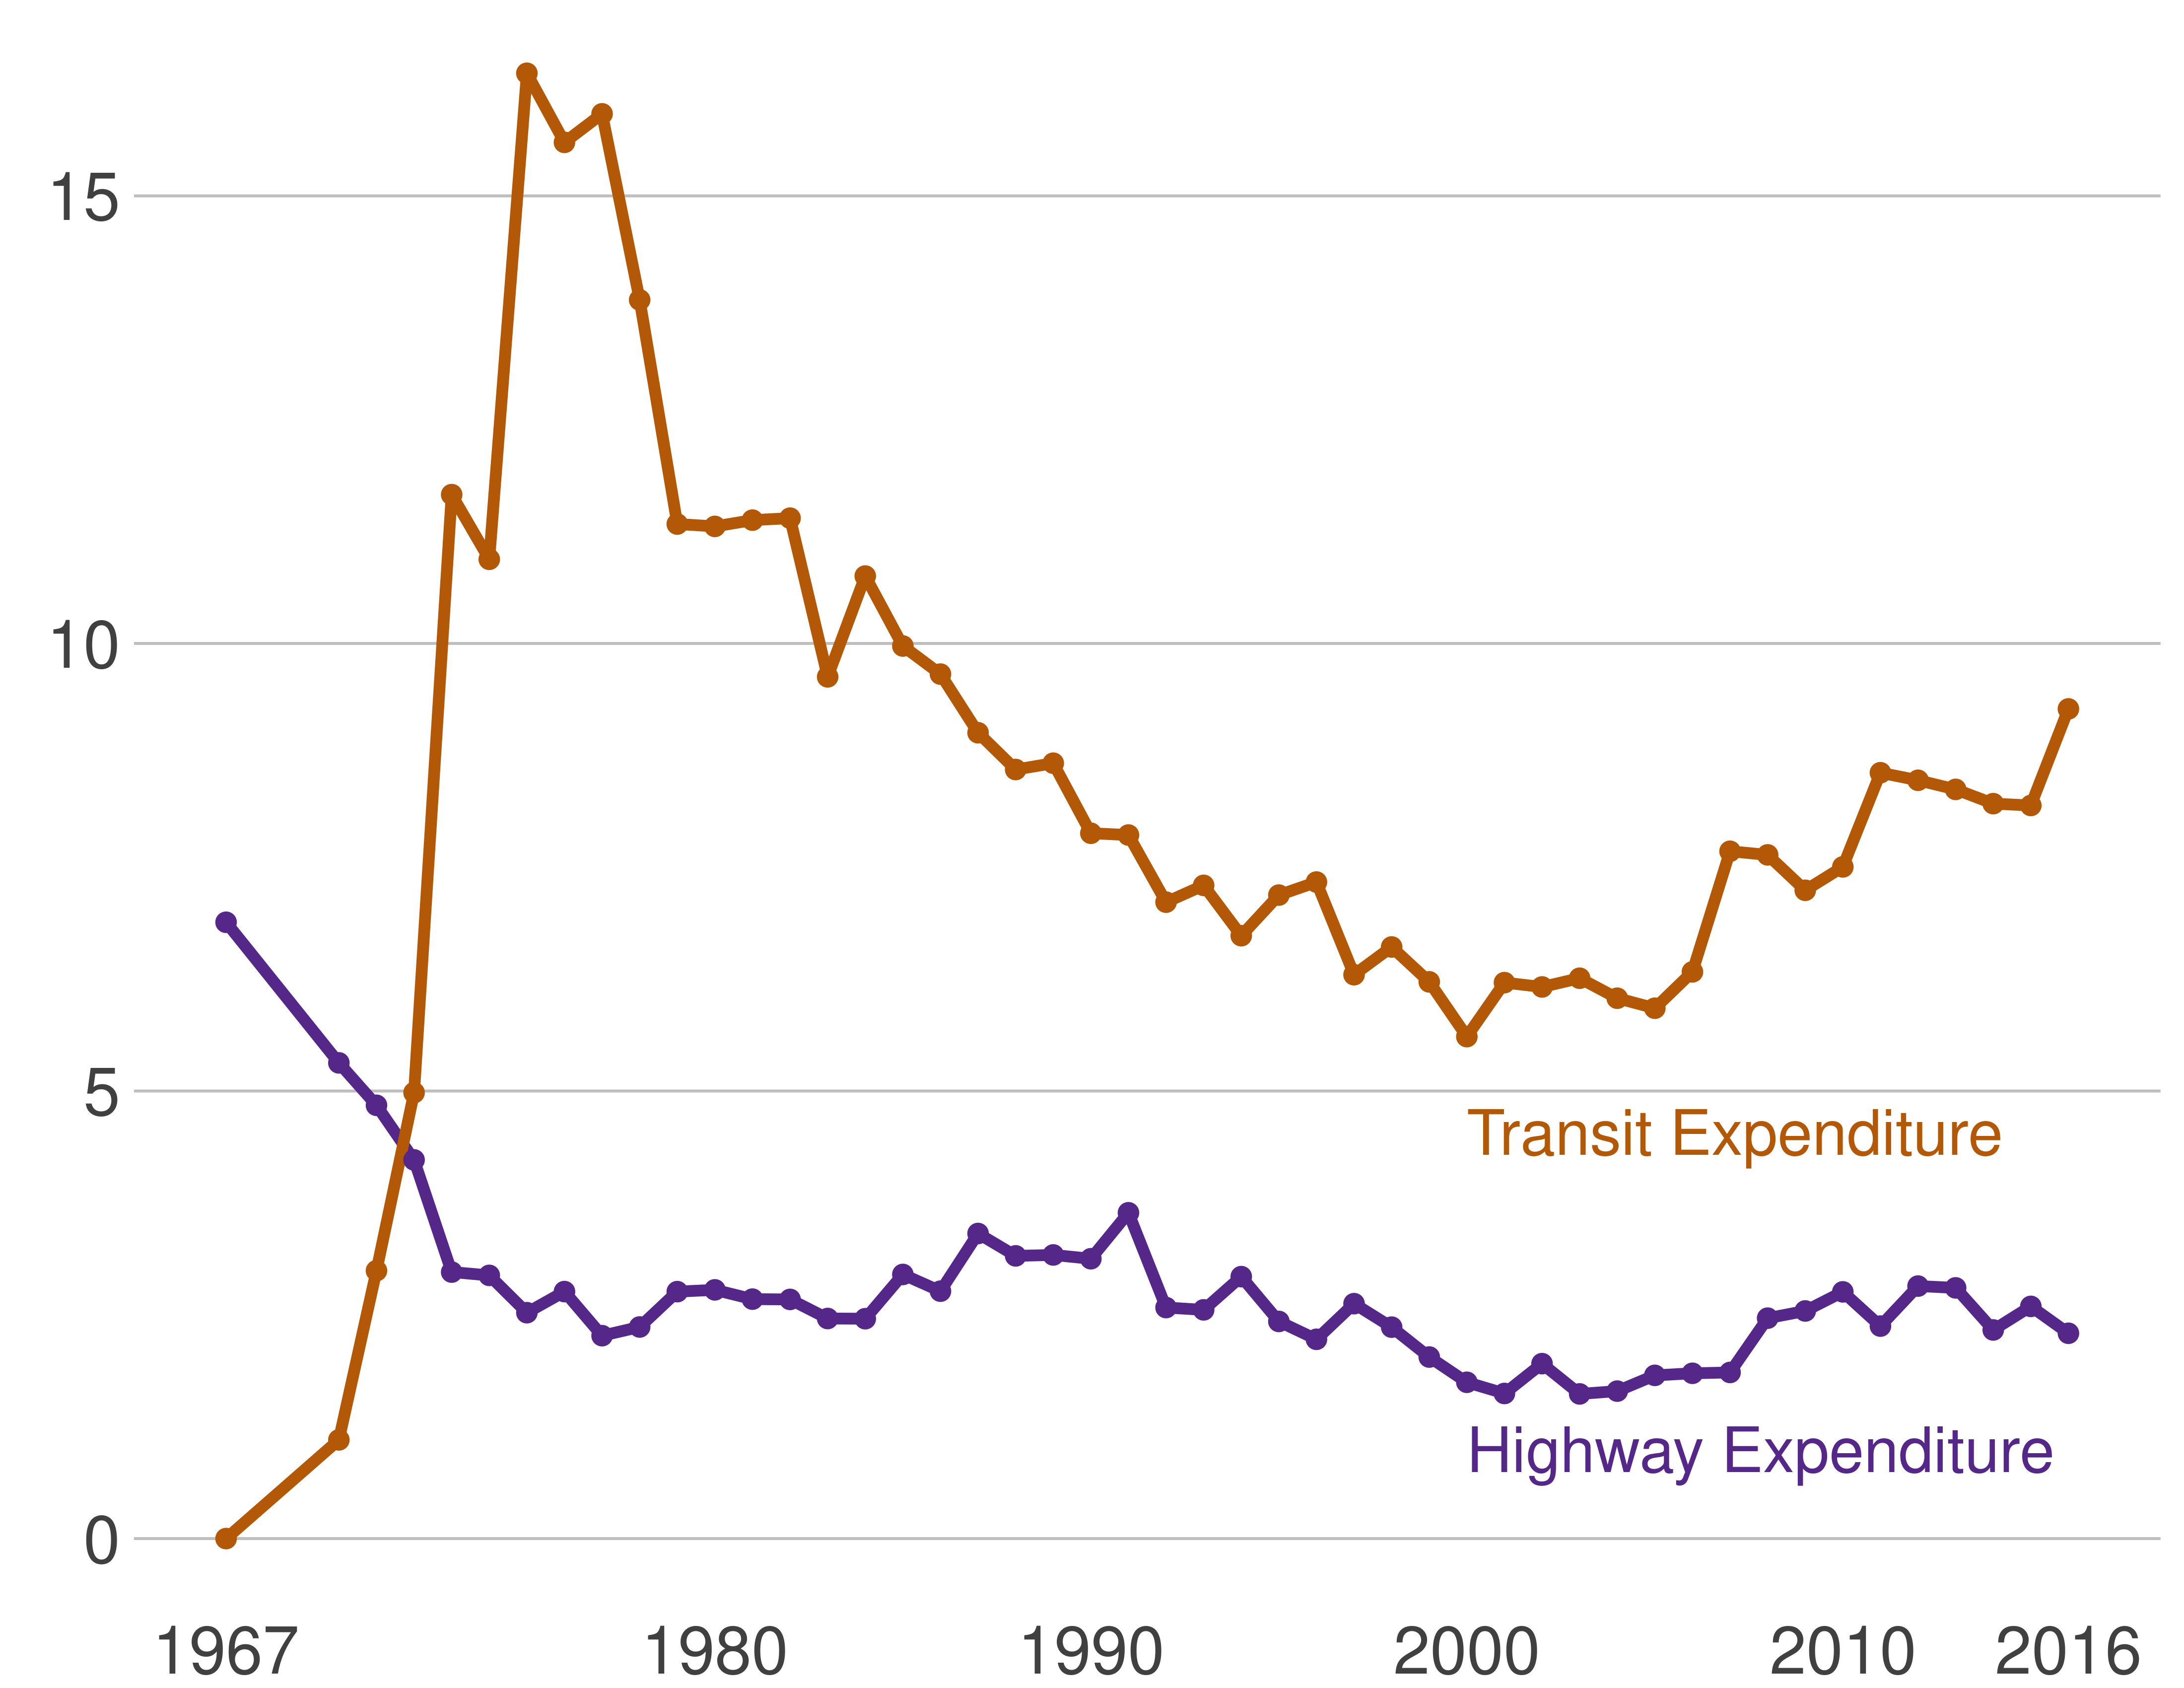
Source: Census of Governments 1967-2016.
Note: These figures include all local governments that report information to the Census of Governments, including, but not limited to, counties and cities.
In this light it should come as no surprise that WMATA, which oversees the majority of the region’s Metrorail and bus infrastructure, is spending more and has fewer riders. As a result, expenditures per ride have climbed to new heights. Figure 3.2 displays inflation-adjusted per ride operating costs for Metrobus and Metrorail since 2006. These costs exclude capital investments, such as the Silver Line expansion. Therefore, if anything they paint too rosy a picture of WMATA’s financial woes.
Even before the COVID-19 pandemic, WMATA’s per-trip operating costs gradually increased. In 2006, the per-trip rail was $4.05 and the per-trip bus cost was $4.18. However, during the public health crisis, plummeting ridership on both the bus and rail lines has resulted in skyrocketing per-ride expenditures. In fact, Figure 3.2 documents a 600 percent increase in rail operating costs per trip between 2019 and 2021.
Figure 3.2: WMATA Operating Costs per Rail and Bus Trip Skyrocketed During the COVID-19 Pandemic
WMATA expenditures per ride in 2020 dollars, 2006-2021
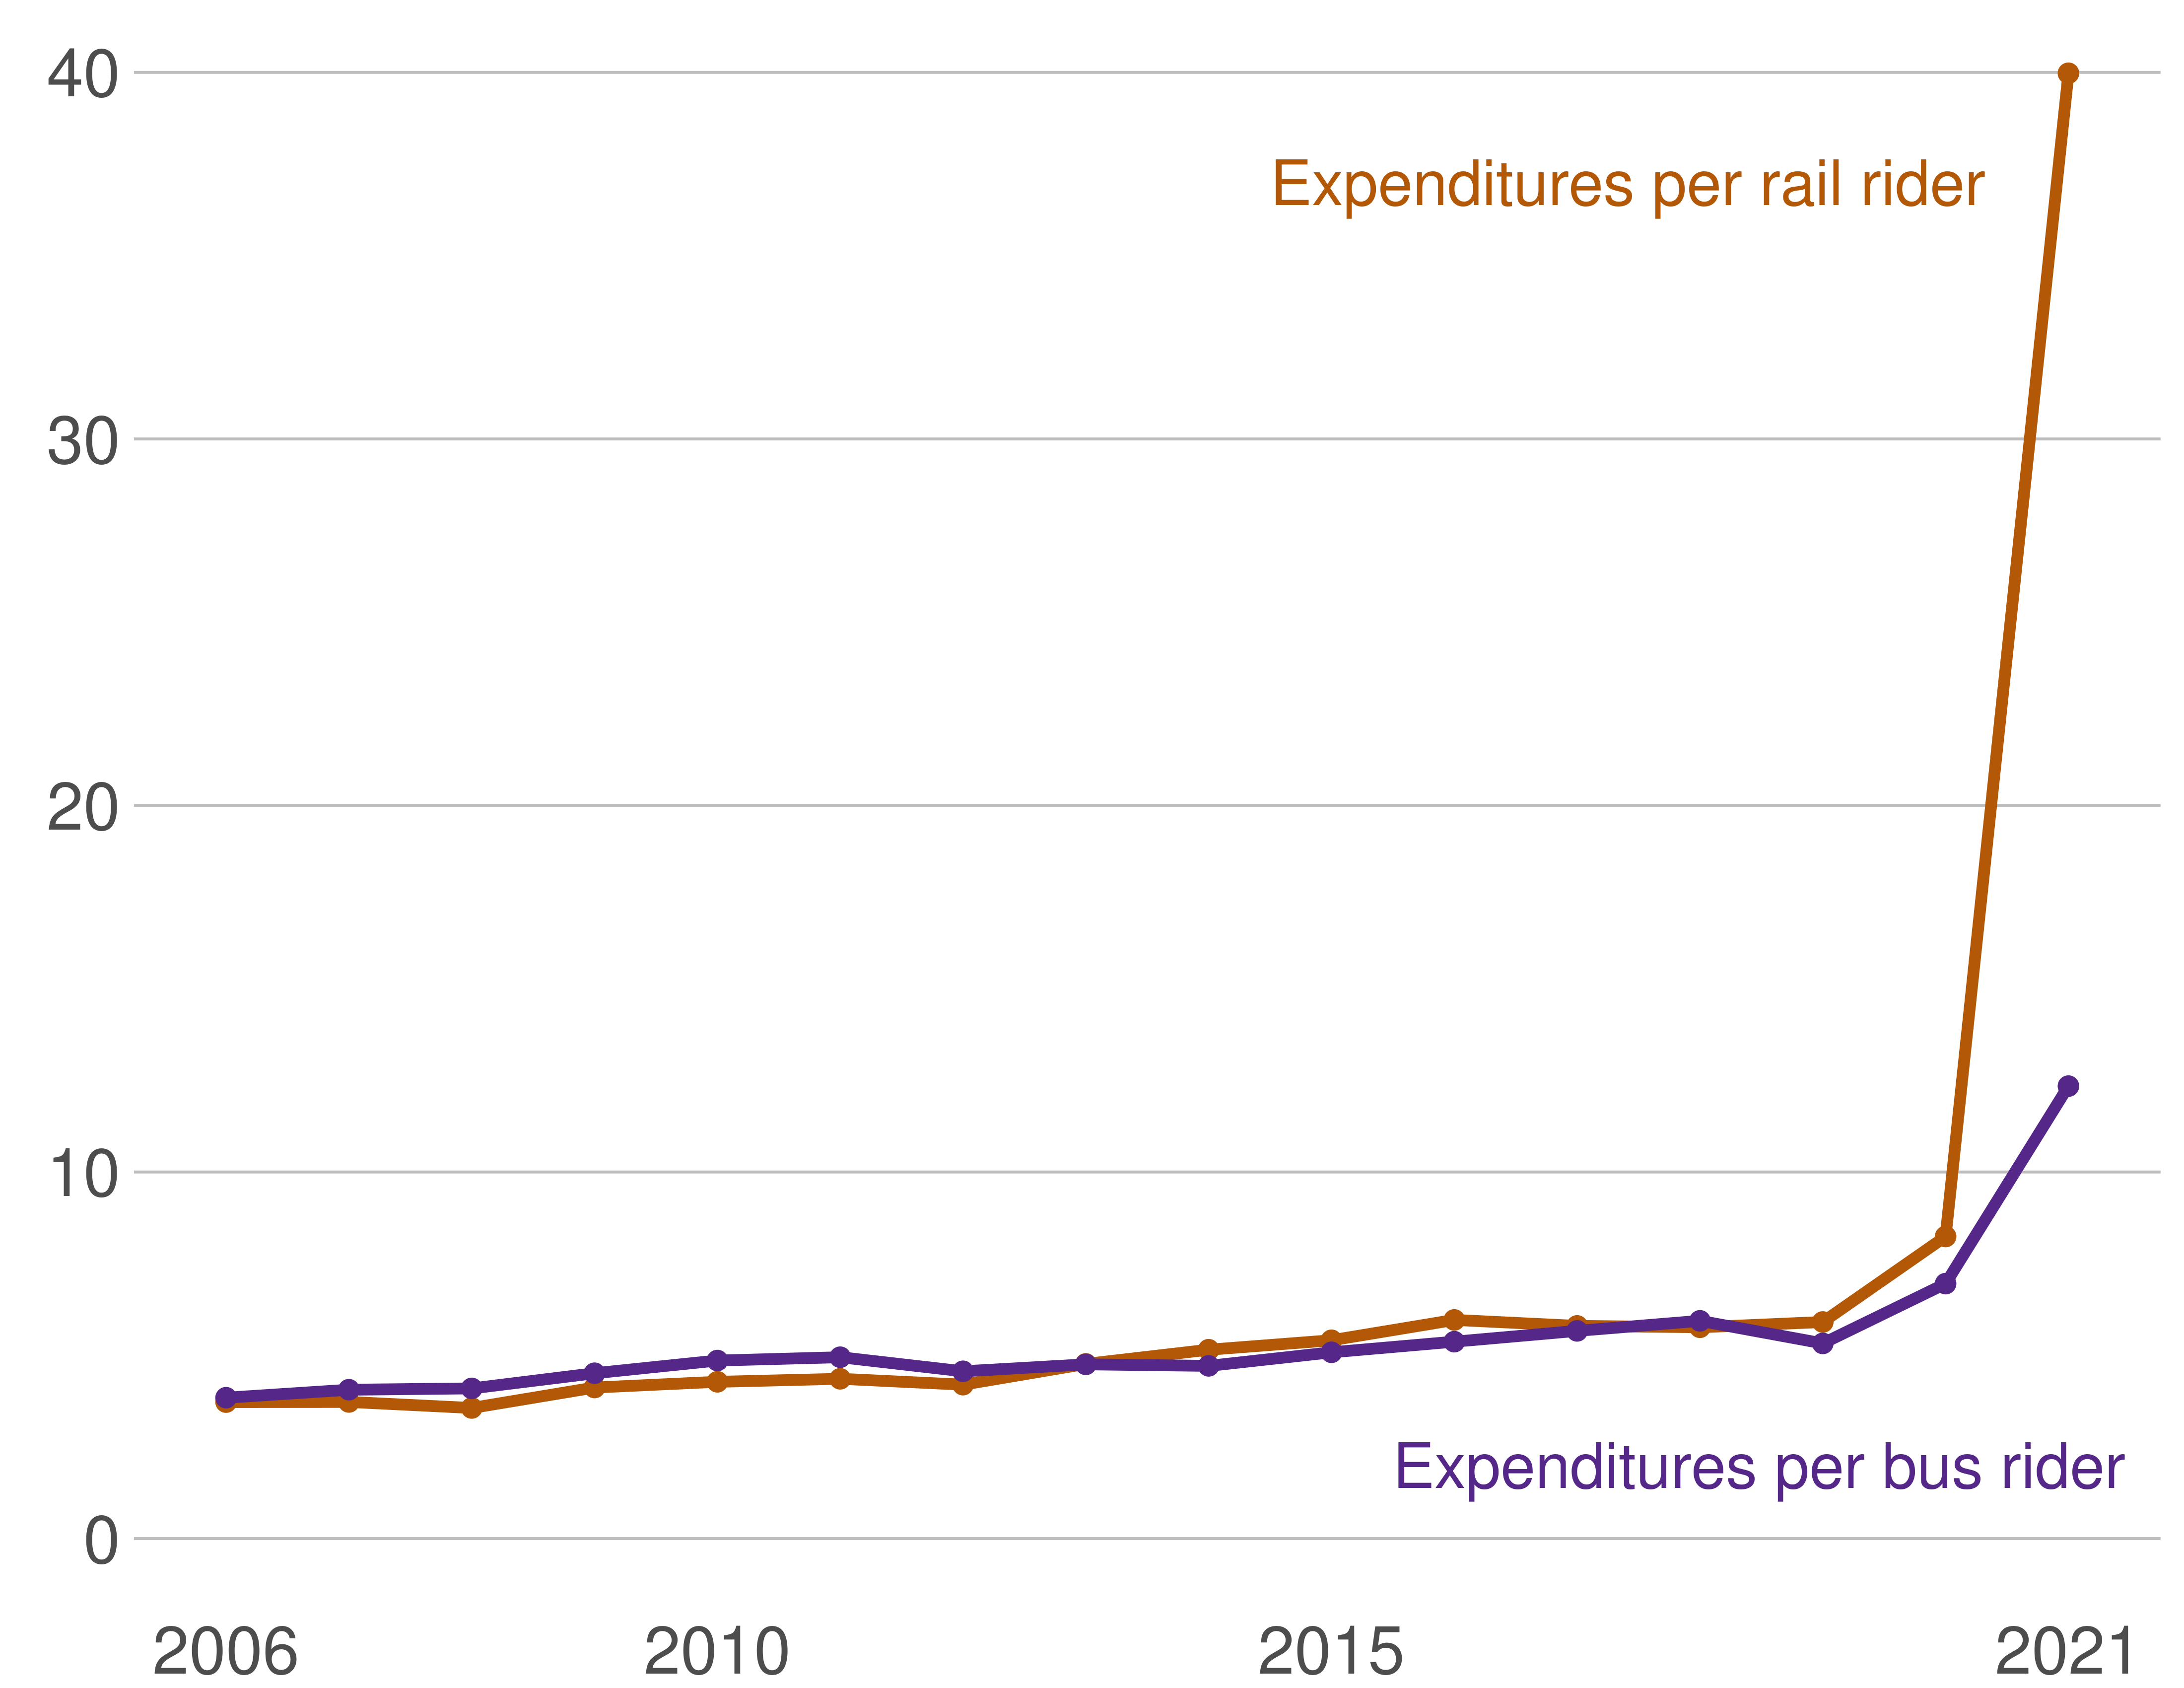
Source: WMATA budget documents. See data sources section for complete information.
While WMATA’s escalating operating costs per trip during the pandemic may be due to truly exceptional circumstances, long-term trends in operating costs suggest that transportation expenditures have outpaced population growth in the region. Figure 3.3 identifies an upward trend in overall expenditures per resident of the Capital Region. After adjusting for inflation, WMATA spending per resident peaked in 2018, increasing by more than $20 per resident since 2006. While this figure has declined since 2018, the cost of operating the system has outpaced population expansion since 2006.
Figure 3.3: WMATA’s Overall Operating Costs per Capital Region Resident Have Climbed Since 2006
WMATA expenditures per resident in 2020 dollars, 2006-2021
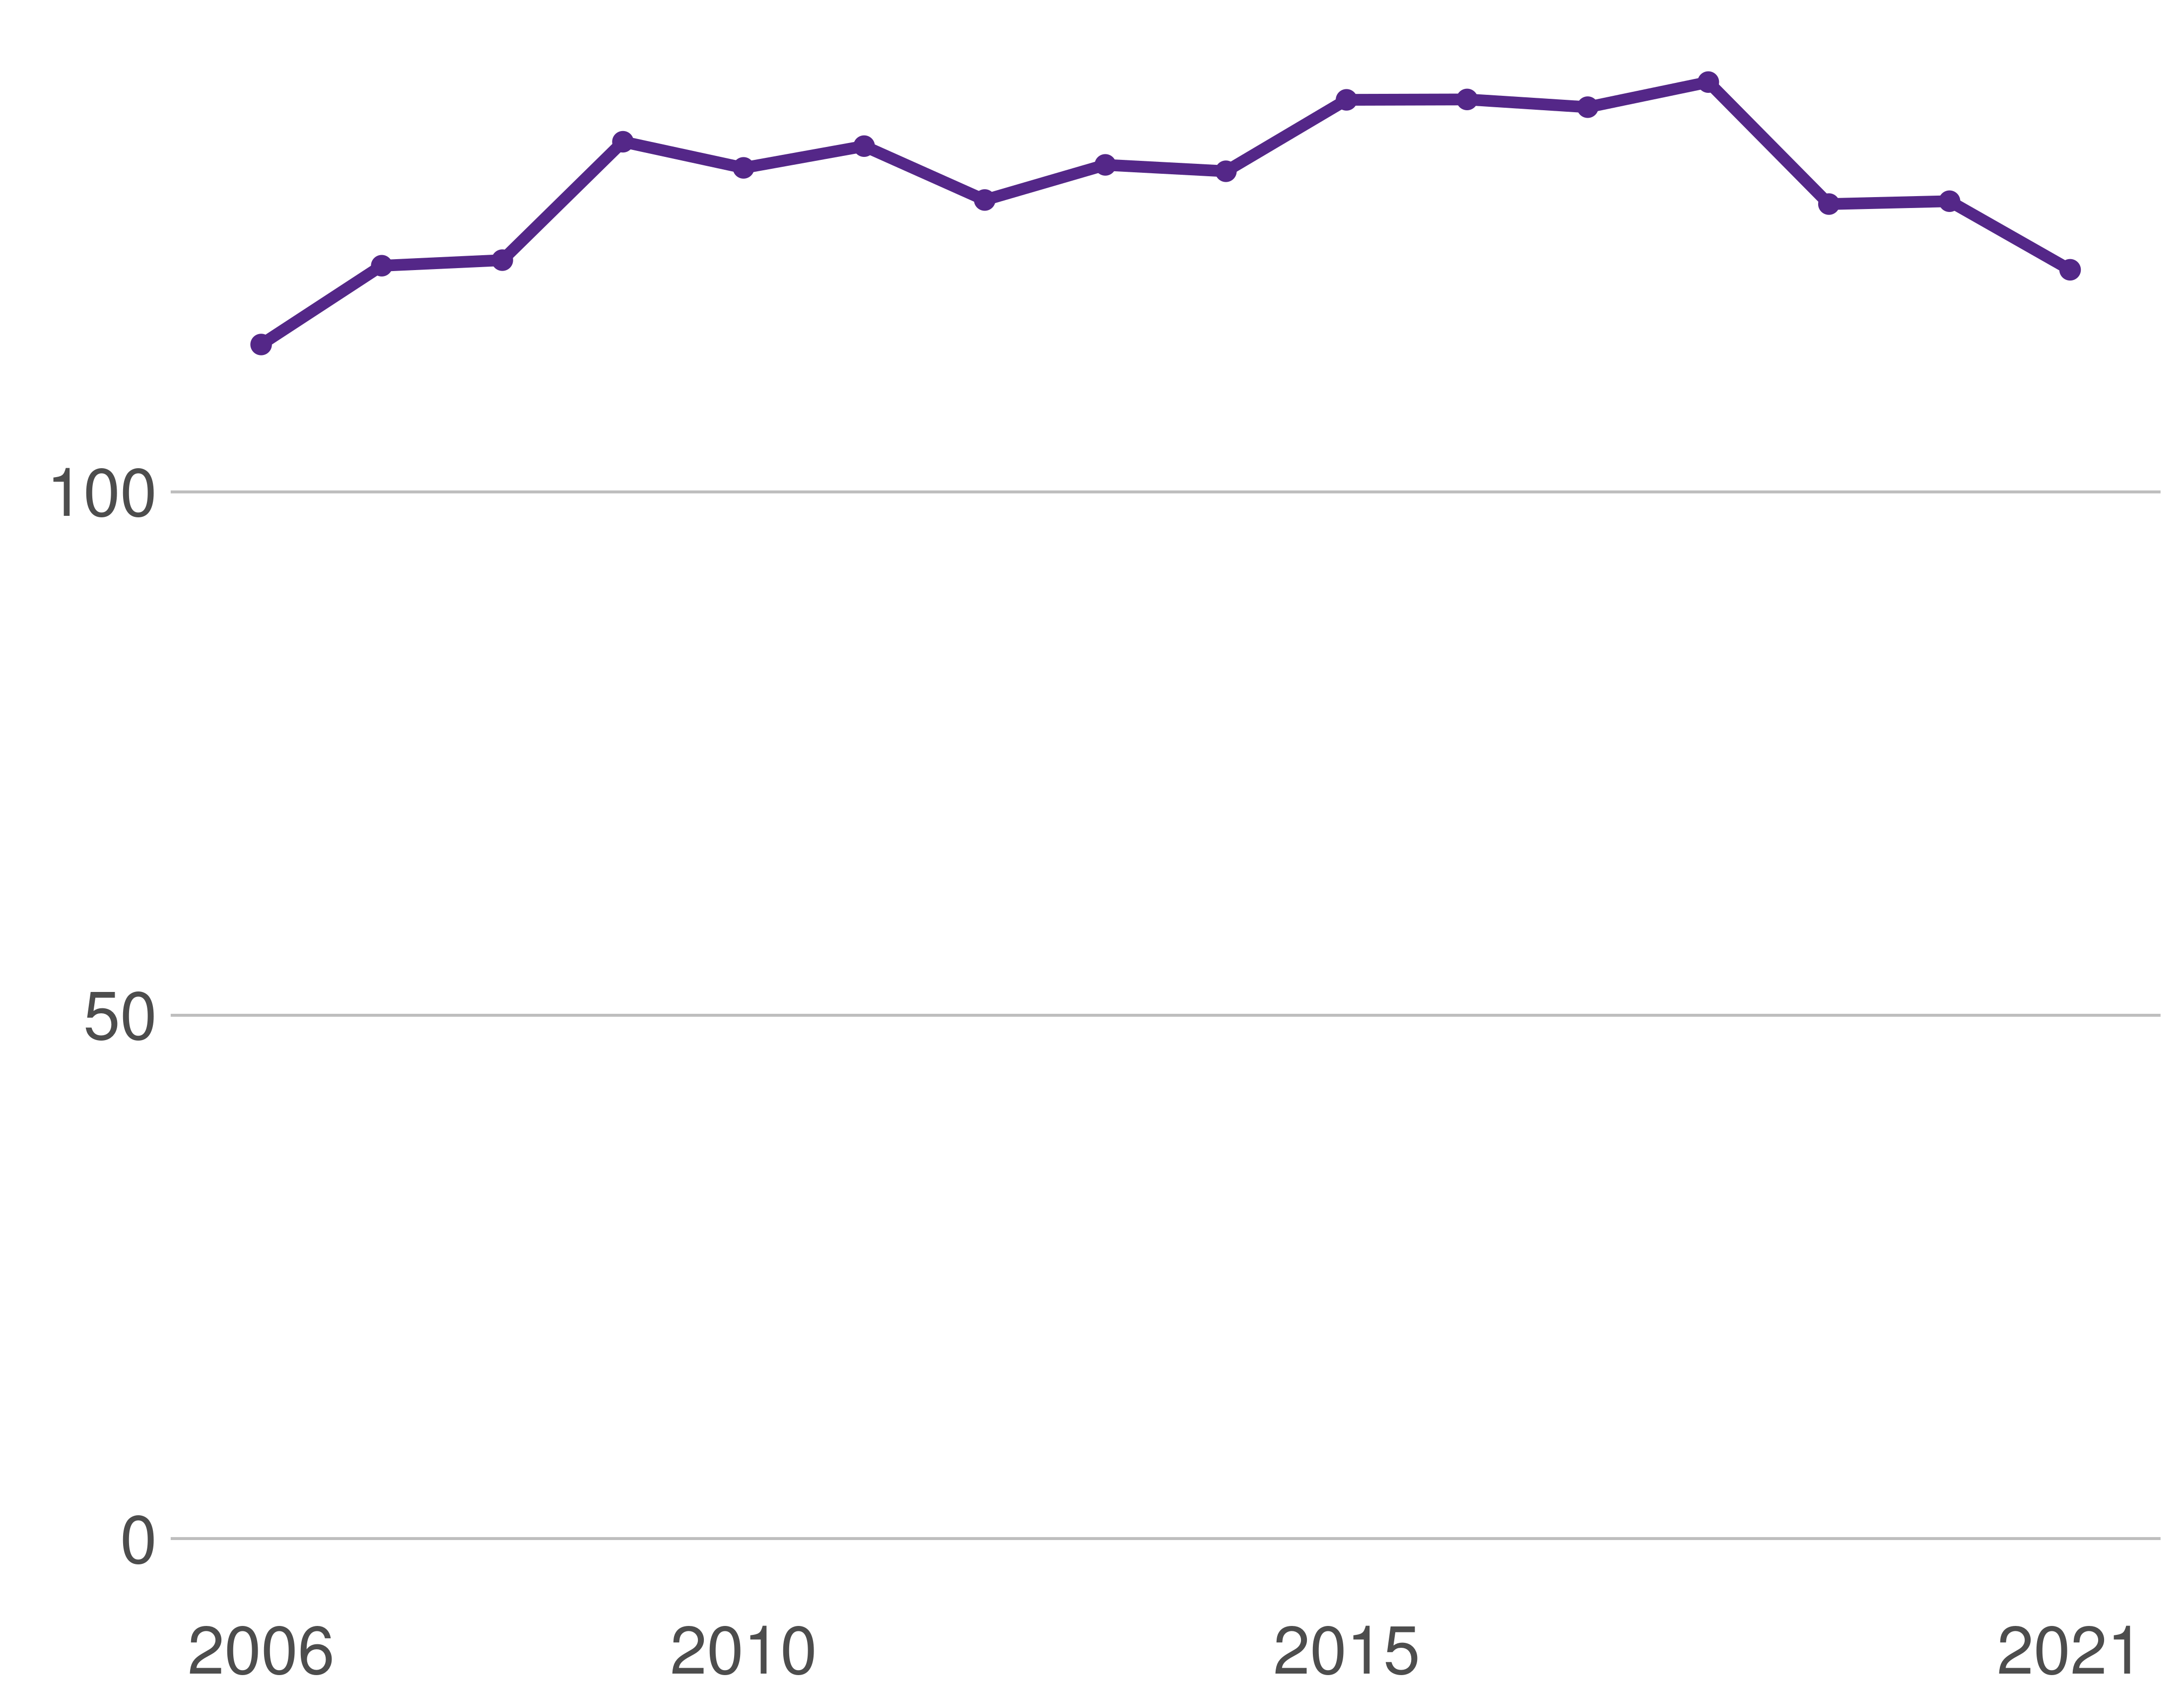
Source: WMATA budget documents. See data sources section for complete information.
Total spending on transit and other transportation infrastructure is composed of many projects, large and small, across the region. Here we highlight a number of large infrastructure projects in the Capital Region. Continuous population growth points to the importance of both maintaining existing infrastructure and investing in new infrastructure.
Notably, many of the costliest public transportation projects are in suburban jurisdictions. These include the extension of the Silver Line into Northern Virginia to Dulles Airport and the development of the Purple Line to serve suburban jurisdictions in Maryland. Outside of the Metrorail system, the construction of the new $1.9 billion Long Bridge over the Potomac River will facilitate Virginia’s broader $3.7 billion passenger rail expansion project.
In addition, several suburban highway projects dominate transportation investment outside the jurisdiction of WMATA. Maryland is devoting over $6 billion to add express lanes to the Capital Beltway and I-270. Virginia is spending a combined $5.1 billion to enhance the I-66 and I-95 corridors through the Transform 66 Outside the Beltway and Atlantic Gateway projects. These projects will devote considerable funding to adding tolled express lanes.
Within the District, bridge replacements are among the highest spending transportation investments. The Frederick Douglass Memorial Bridge, which is part of the ongoing $1 billion South Capitol Street Corridor Project, marks the District’s most ambitious transportation investment. District Mayor Muriel Bowser recently allocated $215 million to replace the H Street Bridge adjacent to Union Station too.
Finally, several alternative transportation investments in the District have received considerable media attention, including the expansion of the streetcar network, the reimagination of K Street, the development of Priority Bus Lanes, and the expansion of the Capital Bikeshare network. Discussion of a proposed gondola connecting Georgetown to Rosslyn has raised the possibility of improved access to a notoriously inaccessible neighborhood. While these projects have garnered substantial public attention, they are—at least for now—low cost relative to highway investments and Metrorail expansions.
Figure 3.4 provides a partial list of these transportation infrastructure projects from throughout the Capital Region. Notably, it points to the disparate costs of major infrastructure costs. The development of highway express lanes and Metrorail expansions are substantially more costly than investments in streetcar or Capital Bikeshare.
Figure 3.4: Highway Express Lanes and Metrorail Expansions Are the Costliest Infrastructure Projects in the Region
Recent Capitol Region infrastructure projects, billions of dollars
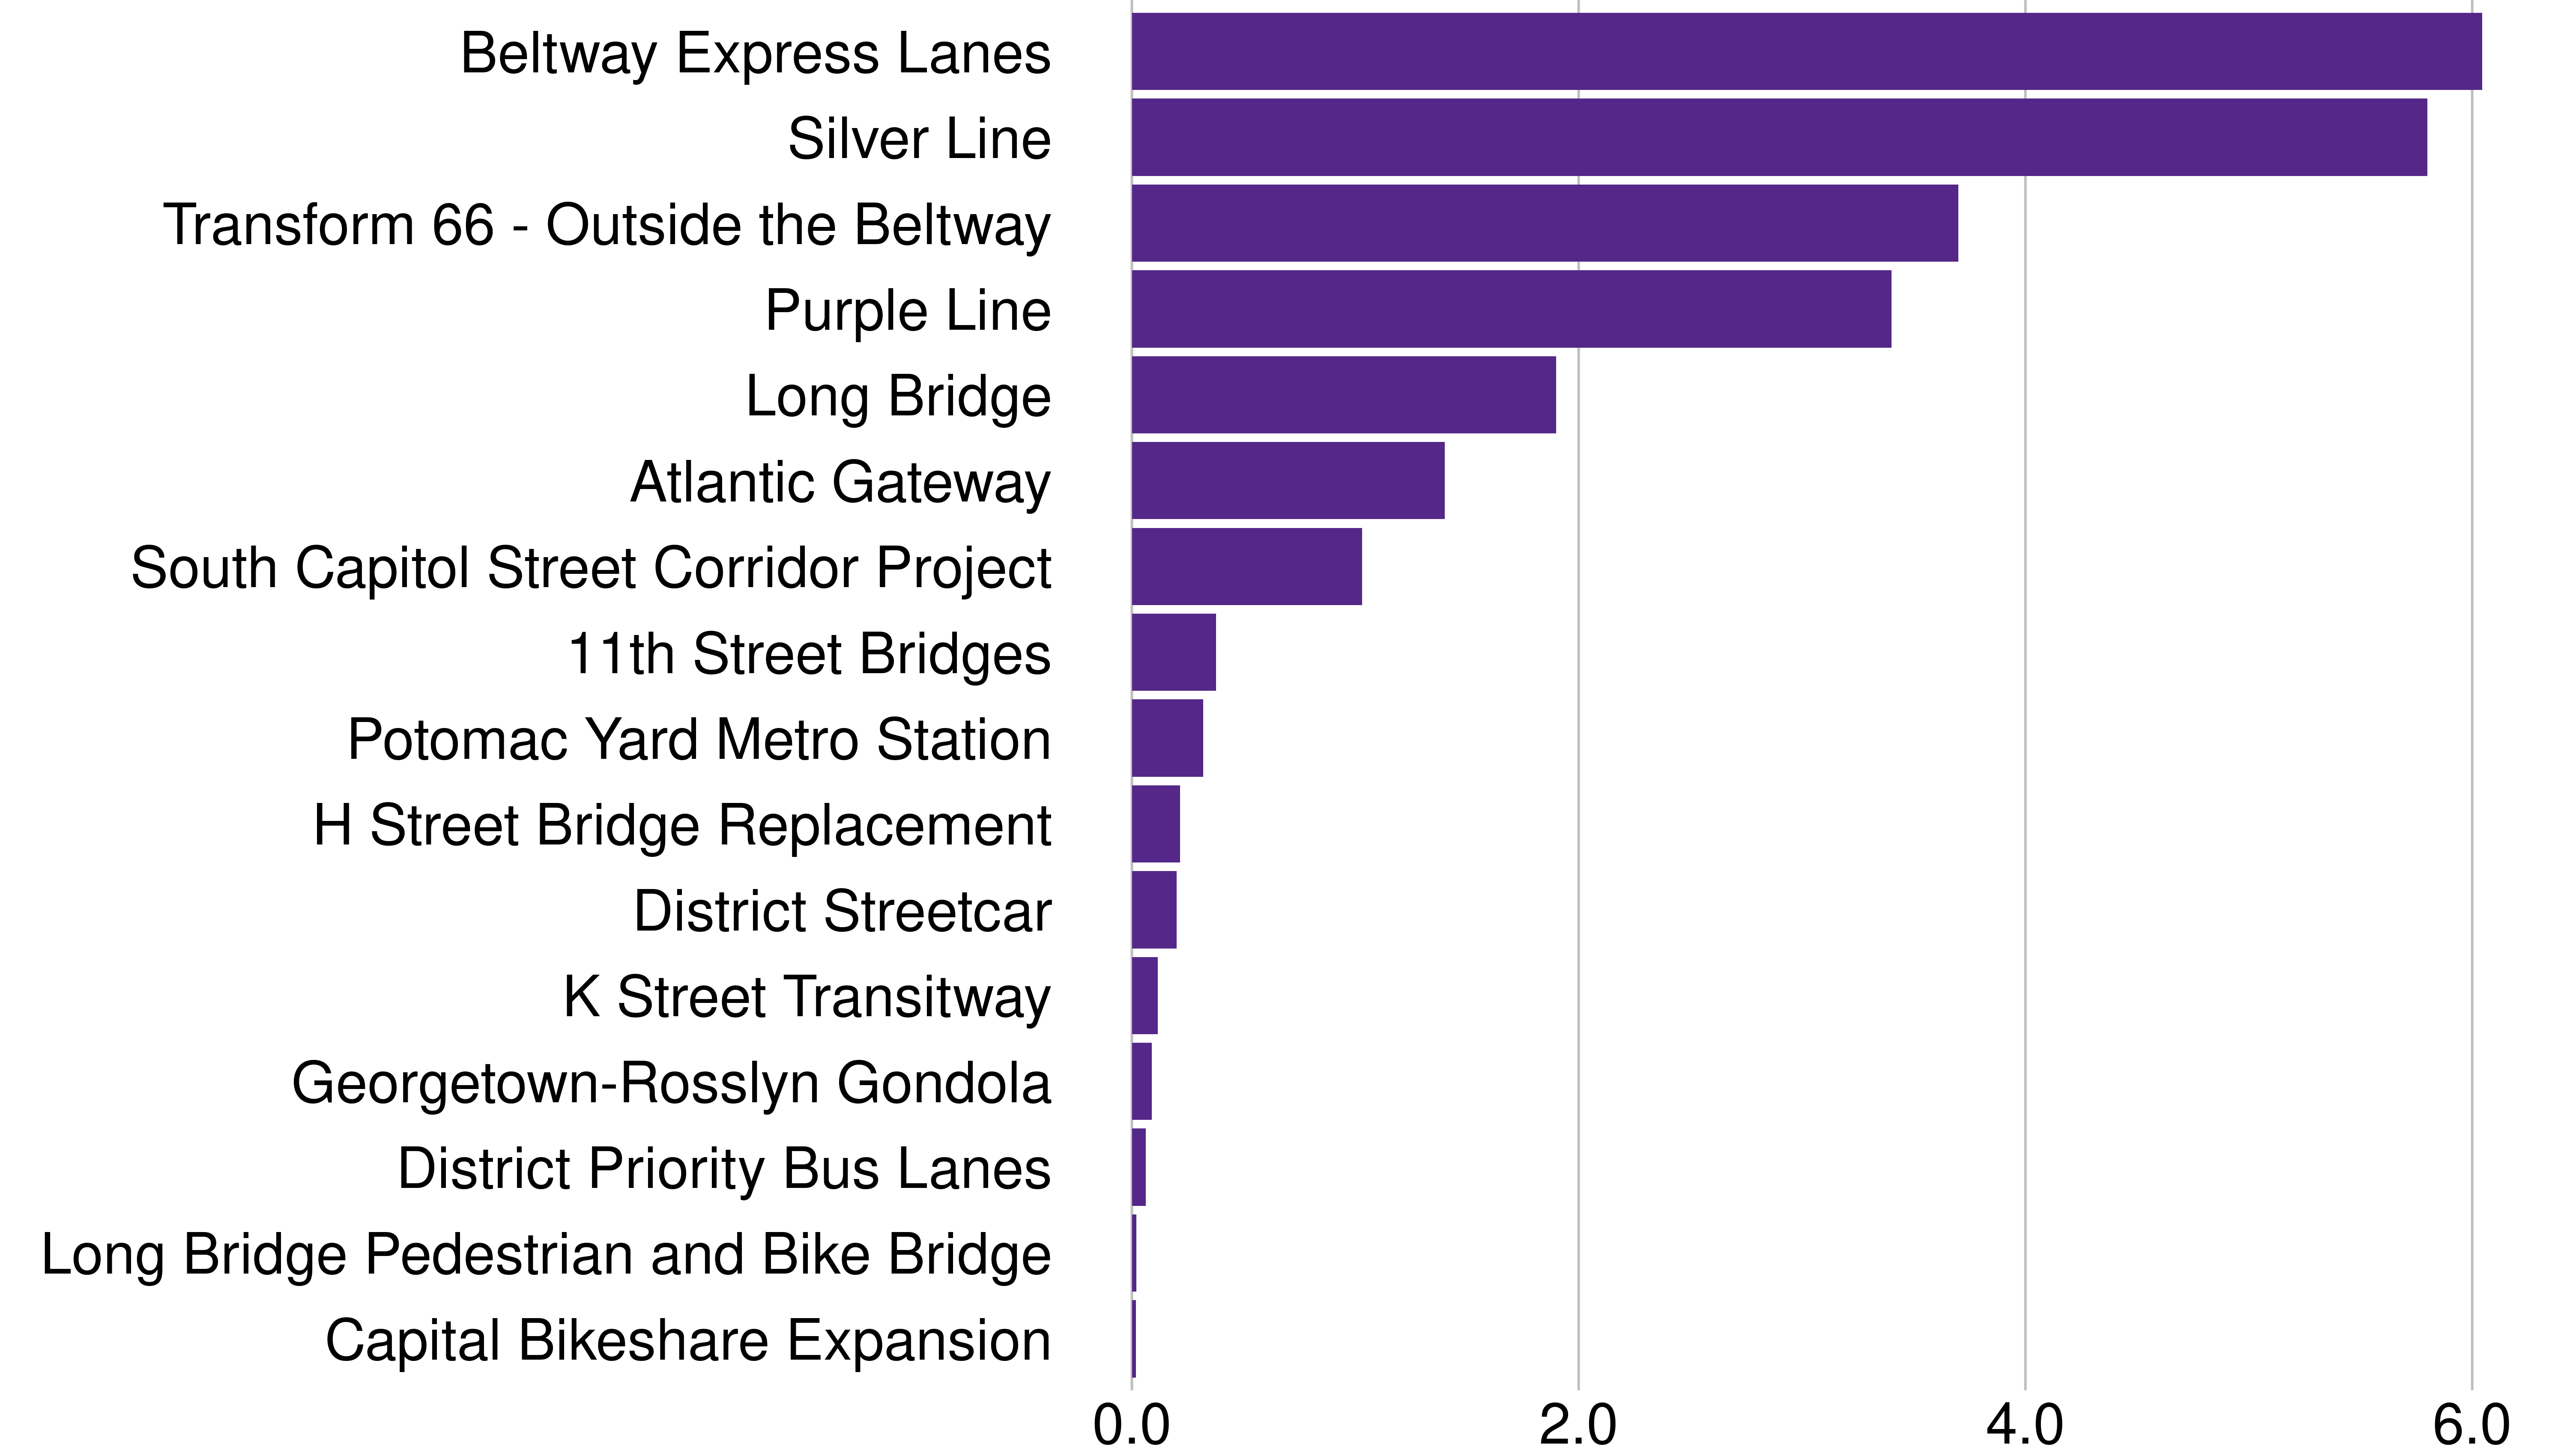
Source: See data sources section for complete information.