1 Chapter 1: The Public and Transportation
Our introduction established the strong pattern of cars as the predominant travel mode in the Capital Region with public transportation a distant second. In this chapter, we provide more context around mode choice and travel destination within the region.
Figure 1.1 looks more closely at commuting patterns as of 2019 and focuses on differences in commuting mode by urban, suburban, and exurban jurisdiction typology within the Capital Region. While driving is the dominant commuting mode for all three area types, it’s clear that there are large differences between the urban core and suburban/exurban areas. Over 80 percent of exurban commuters and 70 percent of suburban commuters drive, compared to around half of commuters living in the urban core. Exurban areas have the largest share of car use for commutes in the region, including carpool commutes. In suburban jurisdictions, a majority of commuters also use cars or car pools as their primary mode of choice. Urban jurisdictions, on the other hand, still see almost half of commutes by car, but they also have by far the largest shares of commuters using public transportation (over one-third), walking, and even traveling by bicycle, motorcycle, or taxi (combined).
Figure 1.1: Exurban Jurisdictions Have the Highest Percentage of Car Commuters
Percent of Capital Region commuters by transportation mode and residential area type, 2019
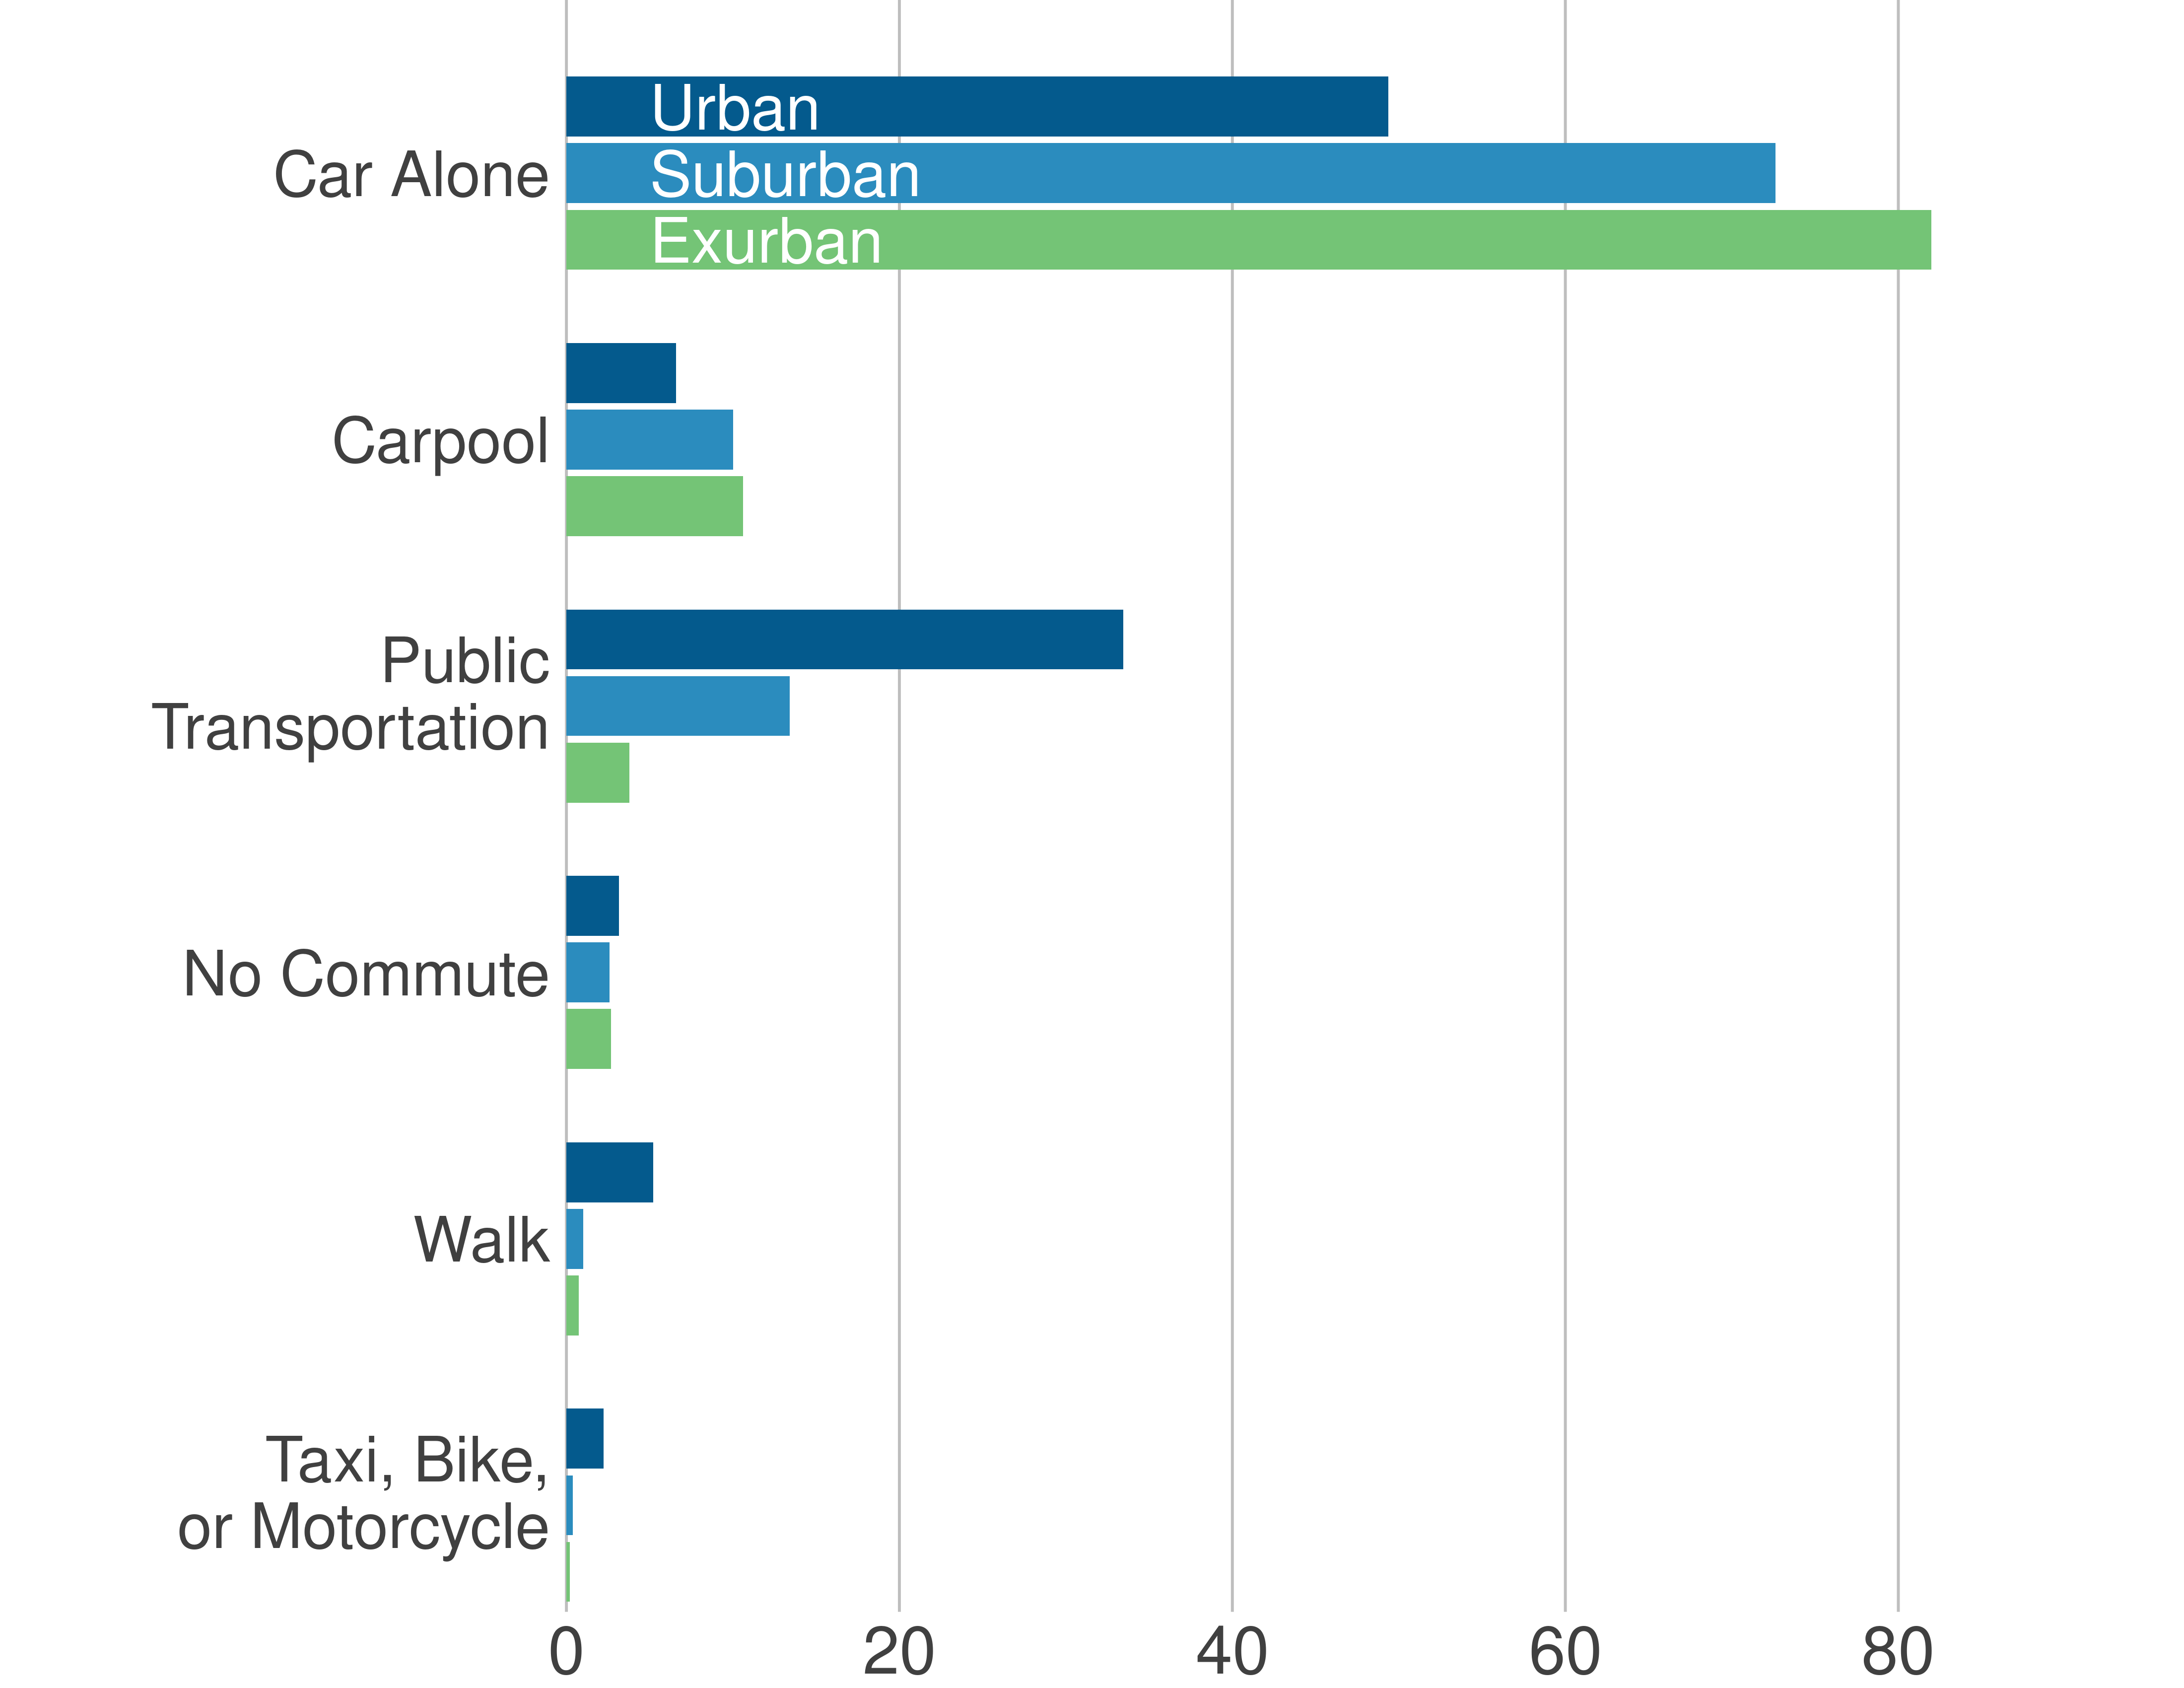
Source: American Community Survey 2015-2019.
Figure 1.2 looks at these same commuting mode choices in the Capital Region, examining differences across racial and ethnic groups. The figure shows again that cars are the most popular transportation mode across all racial ethnic groups. Notably, over 60 percent of Asian and Black1 commuters use cars as the primary mode of transportation to work, nearly twice the share as Hispanic and white commuters. Hispanic commuters have a slightly higher share of carpool use relative to other groups. Public transportation use is relatively consistent across all groups, although slightly higher for Black commuters. White and Hispanic commuters both show somewhat higher shares for bicycle, motorcycle, or taxi, and are more likely to report no commute at all.
Figure 1.2: Car Use Is the Most Common Mode Across All Racial and Ethnic Groups
Percent of commuters by race and ethnicity and transportation mode, 2019
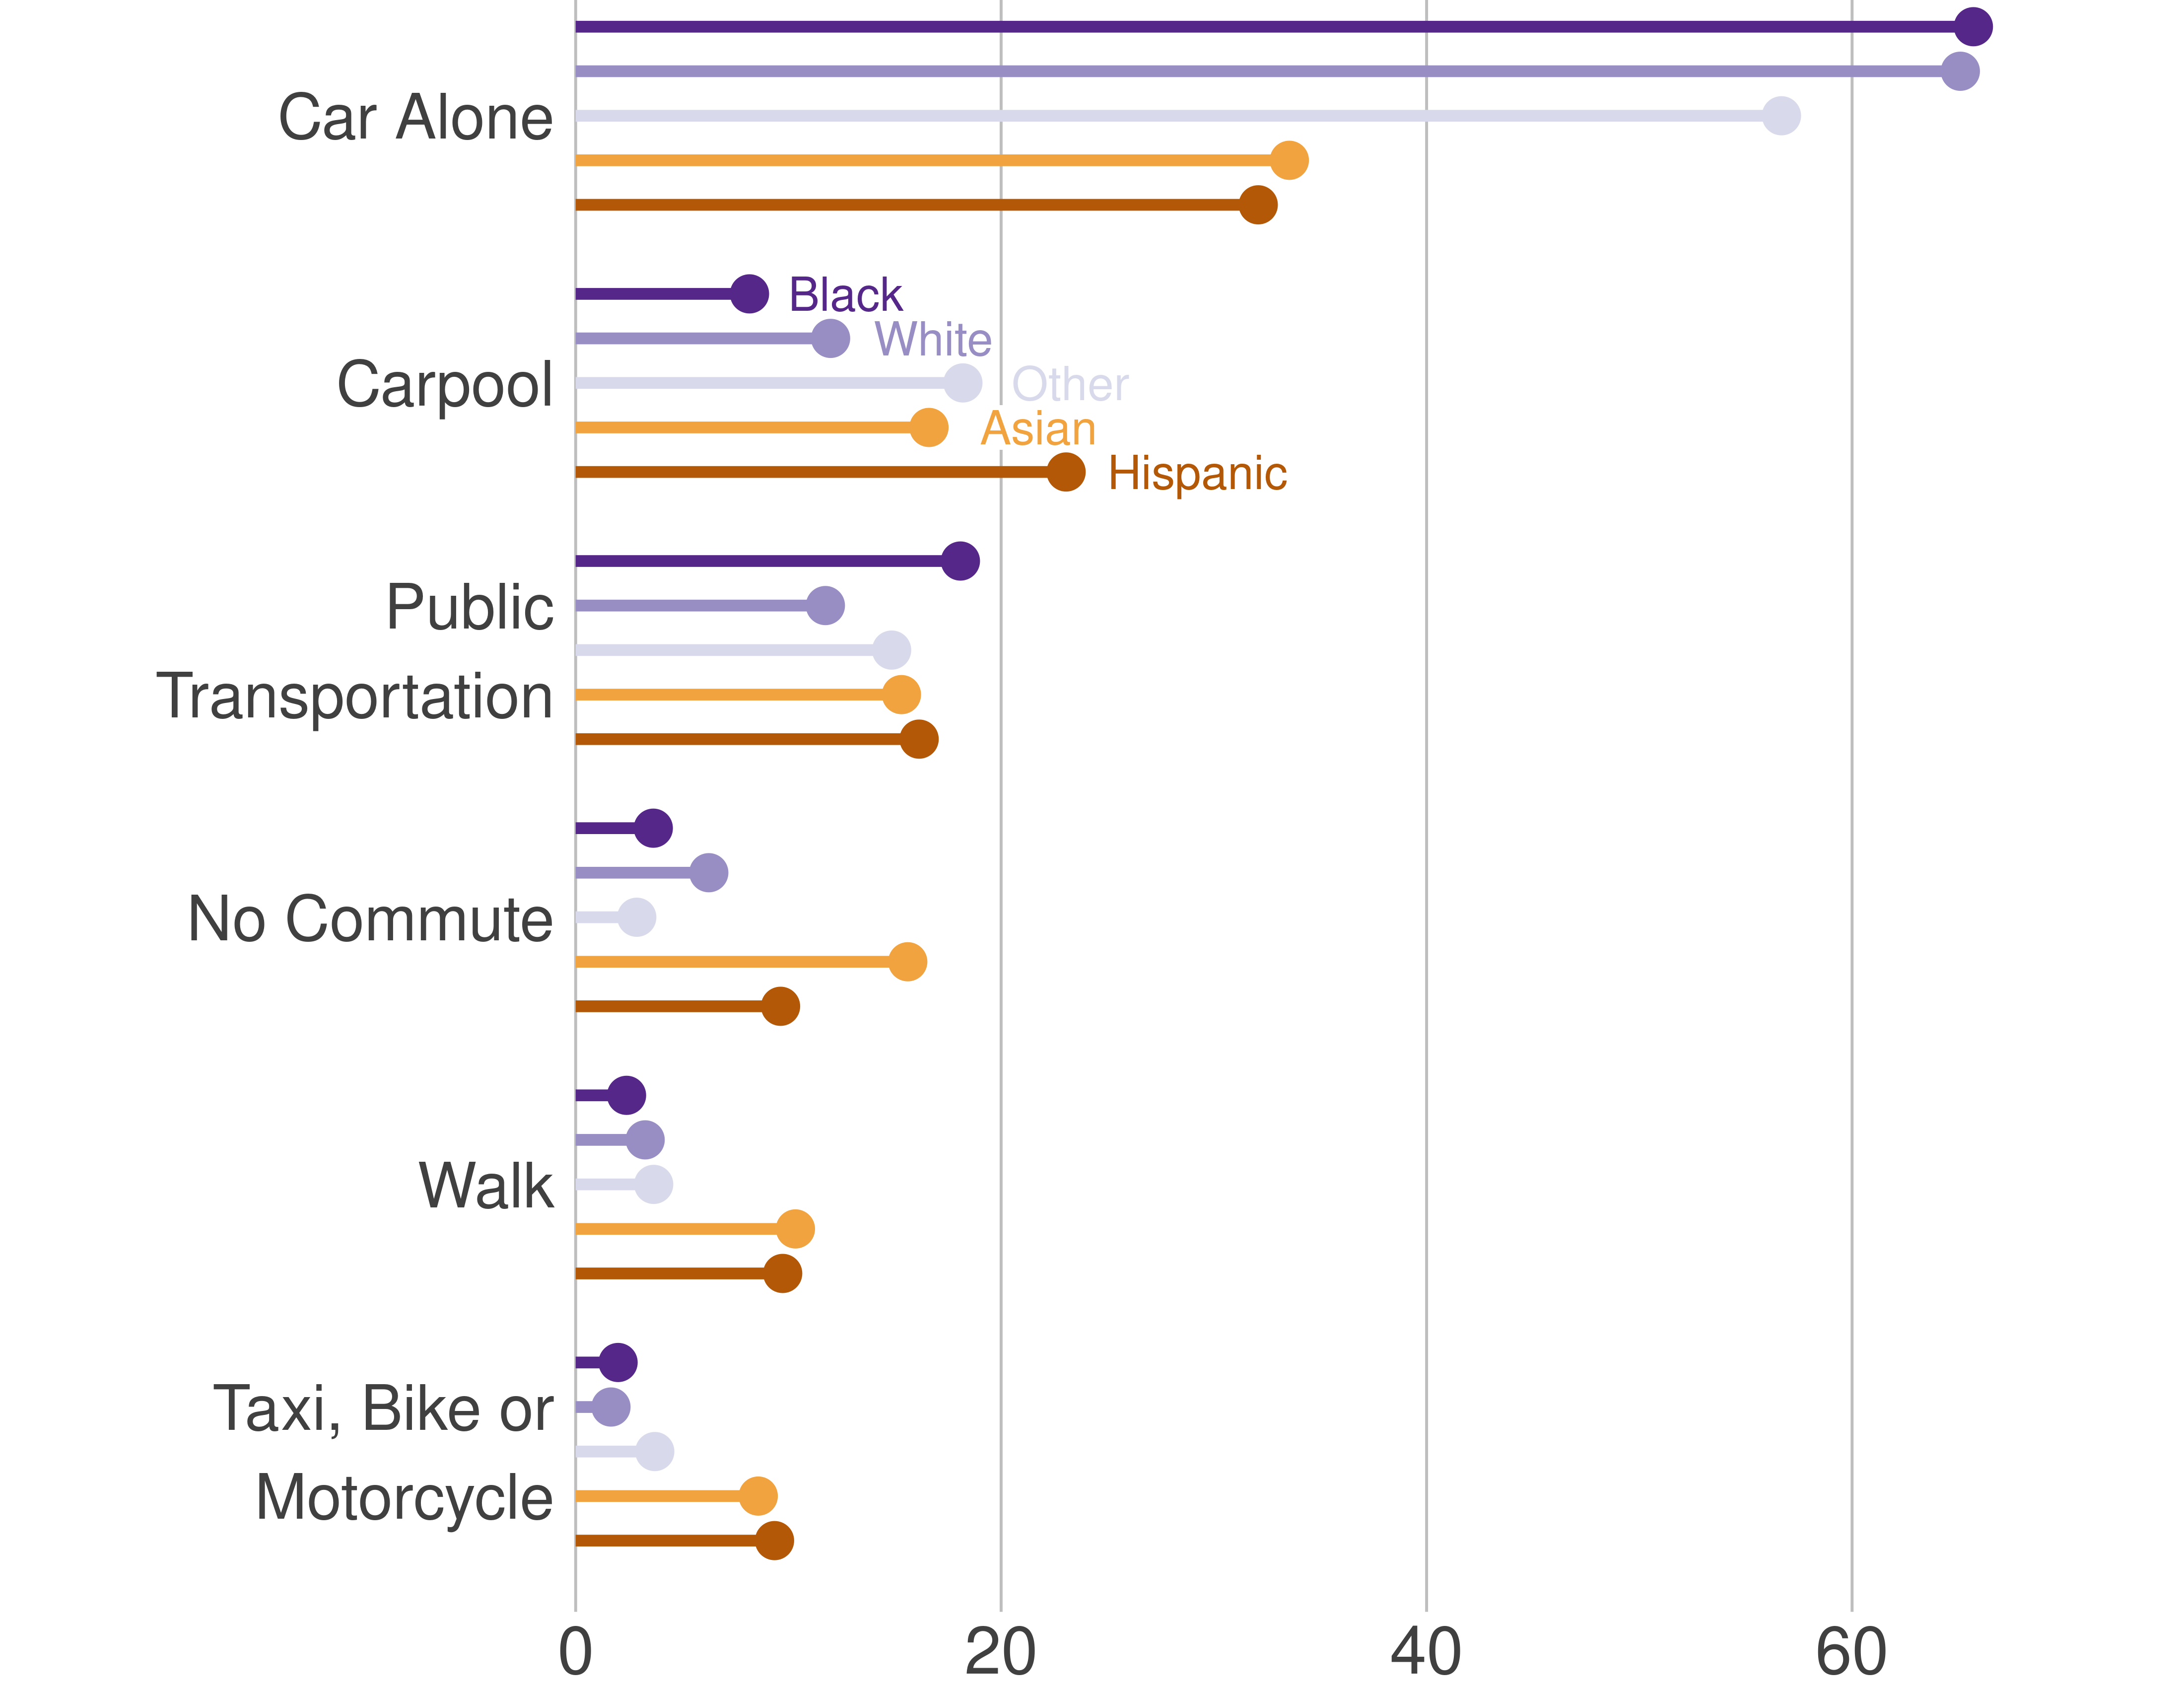
Source: American Community Survey 2015-2019.
The extent of car use does vary substantially across jurisdictions. Figure 1.3 shows average daily vehicle miles traveled (VMT) in the District, as well as the Capital Region jurisdictions in Maryland and in Virginia from 2005 to 2019.2 The District has the lowest average daily VMT per capita, roughly ten less than that of Maryland or Virginia jurisdictions. Similar to overall car use, these patterns have remained fairly consistent over time for Maryland and Virginia jurisdictions, while VMT has been dropping slightly over time for the District. Of course, much of these differences are driven by four key factors that vary across the states and region: residential density, job density, access to public transportation, and proximity to amenities. For example, in last year’s State of the Capital Region report, we showed that most of the jobs in the Capital Region are located in urban and suburban jurisdictions. Commuting mode and proximity to jobs is likely an important component of overall variation in VMT per capita by state.
Figure 1.3: Virginia and Maryland Capital Region Jurisdictions Have Higher Average Daily Vehicle Miles Traveled Than the District
Average daily vehicle miles traveled per resident in Capital Region jurisdictions, 2005-2019
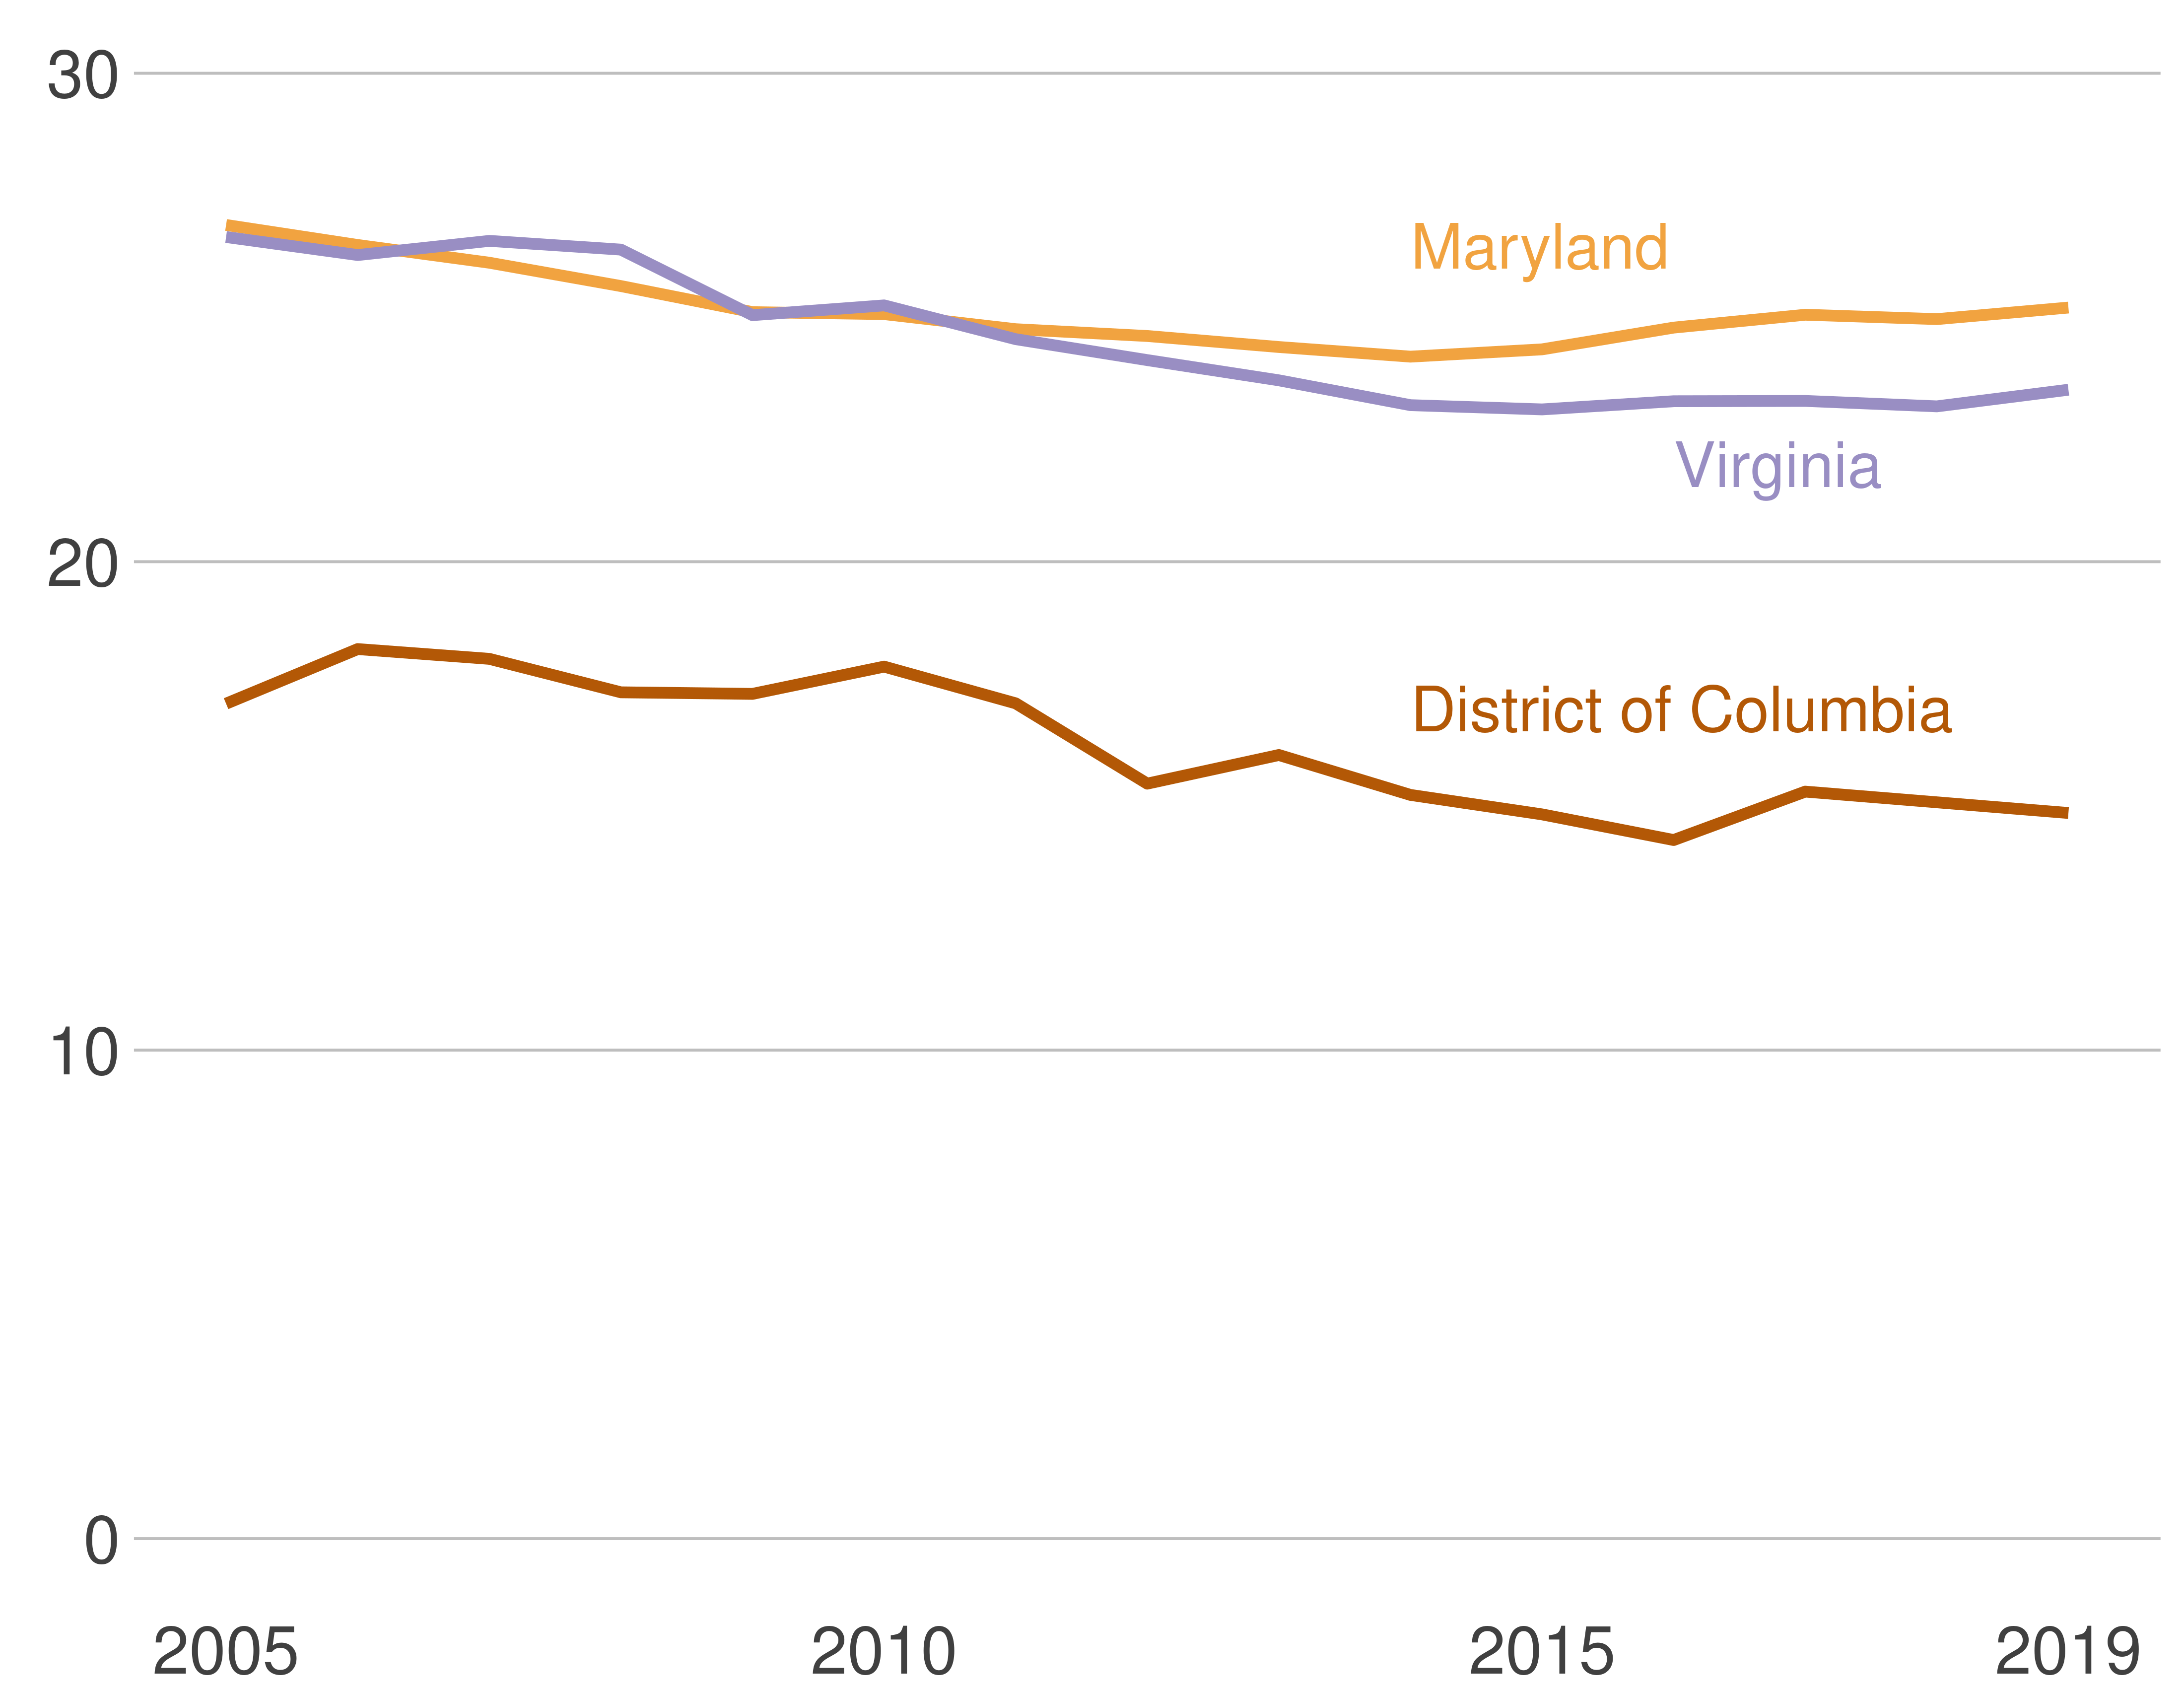
Source:“Traffic Volume Trends,” Federal Highway Administration for the Capital Region, October report, 2005-2019;“2020 Annual Vehicle Miles of Travel in Millions by Functional Classification” Maryland Department of Transportation, yearly report, 2005-2019; “Daily Vehicle Miles Traveled (DVMT) by Physical Jurisdiction, with Towns Combined into Counties”, Virginia Department of Transportation, yearly report, 2005-2019.
Note: This figure includes all Capital Region jurisdictions except for Jefferson County, West Virginia.
Finally, we turn to the direction of commuting patterns in Figure 1.4.The figure shows the commuter’s starting jurisdiction by urban typology on the left axis and the corresponding commute destination on the right axis. While there is some variation across jurisdictions; interestingly, most commutes are within the same jurisdiction type. Suburban jurisdictions are particularly prominent with this pattern—an overwhelming share of suburban commutes start and end in the suburbs and there are very few exurban residents commuting to the suburbs. The urban destinations are similarly dominated by urban commuters, again with very few exurban residents commuting to urban locations. Exurban areas have a similar, although much less dramatic pattern. There is still a relatively large share of exurban-to-exurban commutes, but a less dramatic drop for suburban and urban commuters. Reverse commuting—from urban core to suburbs or exurbs—is much less prevalent than traditional suburb-to-urban core commuting.
Figure 1.4: Suburbs to Suburbs Are the Most Common Commute Pattern
Number of working commuters by residential and job area type, 2019
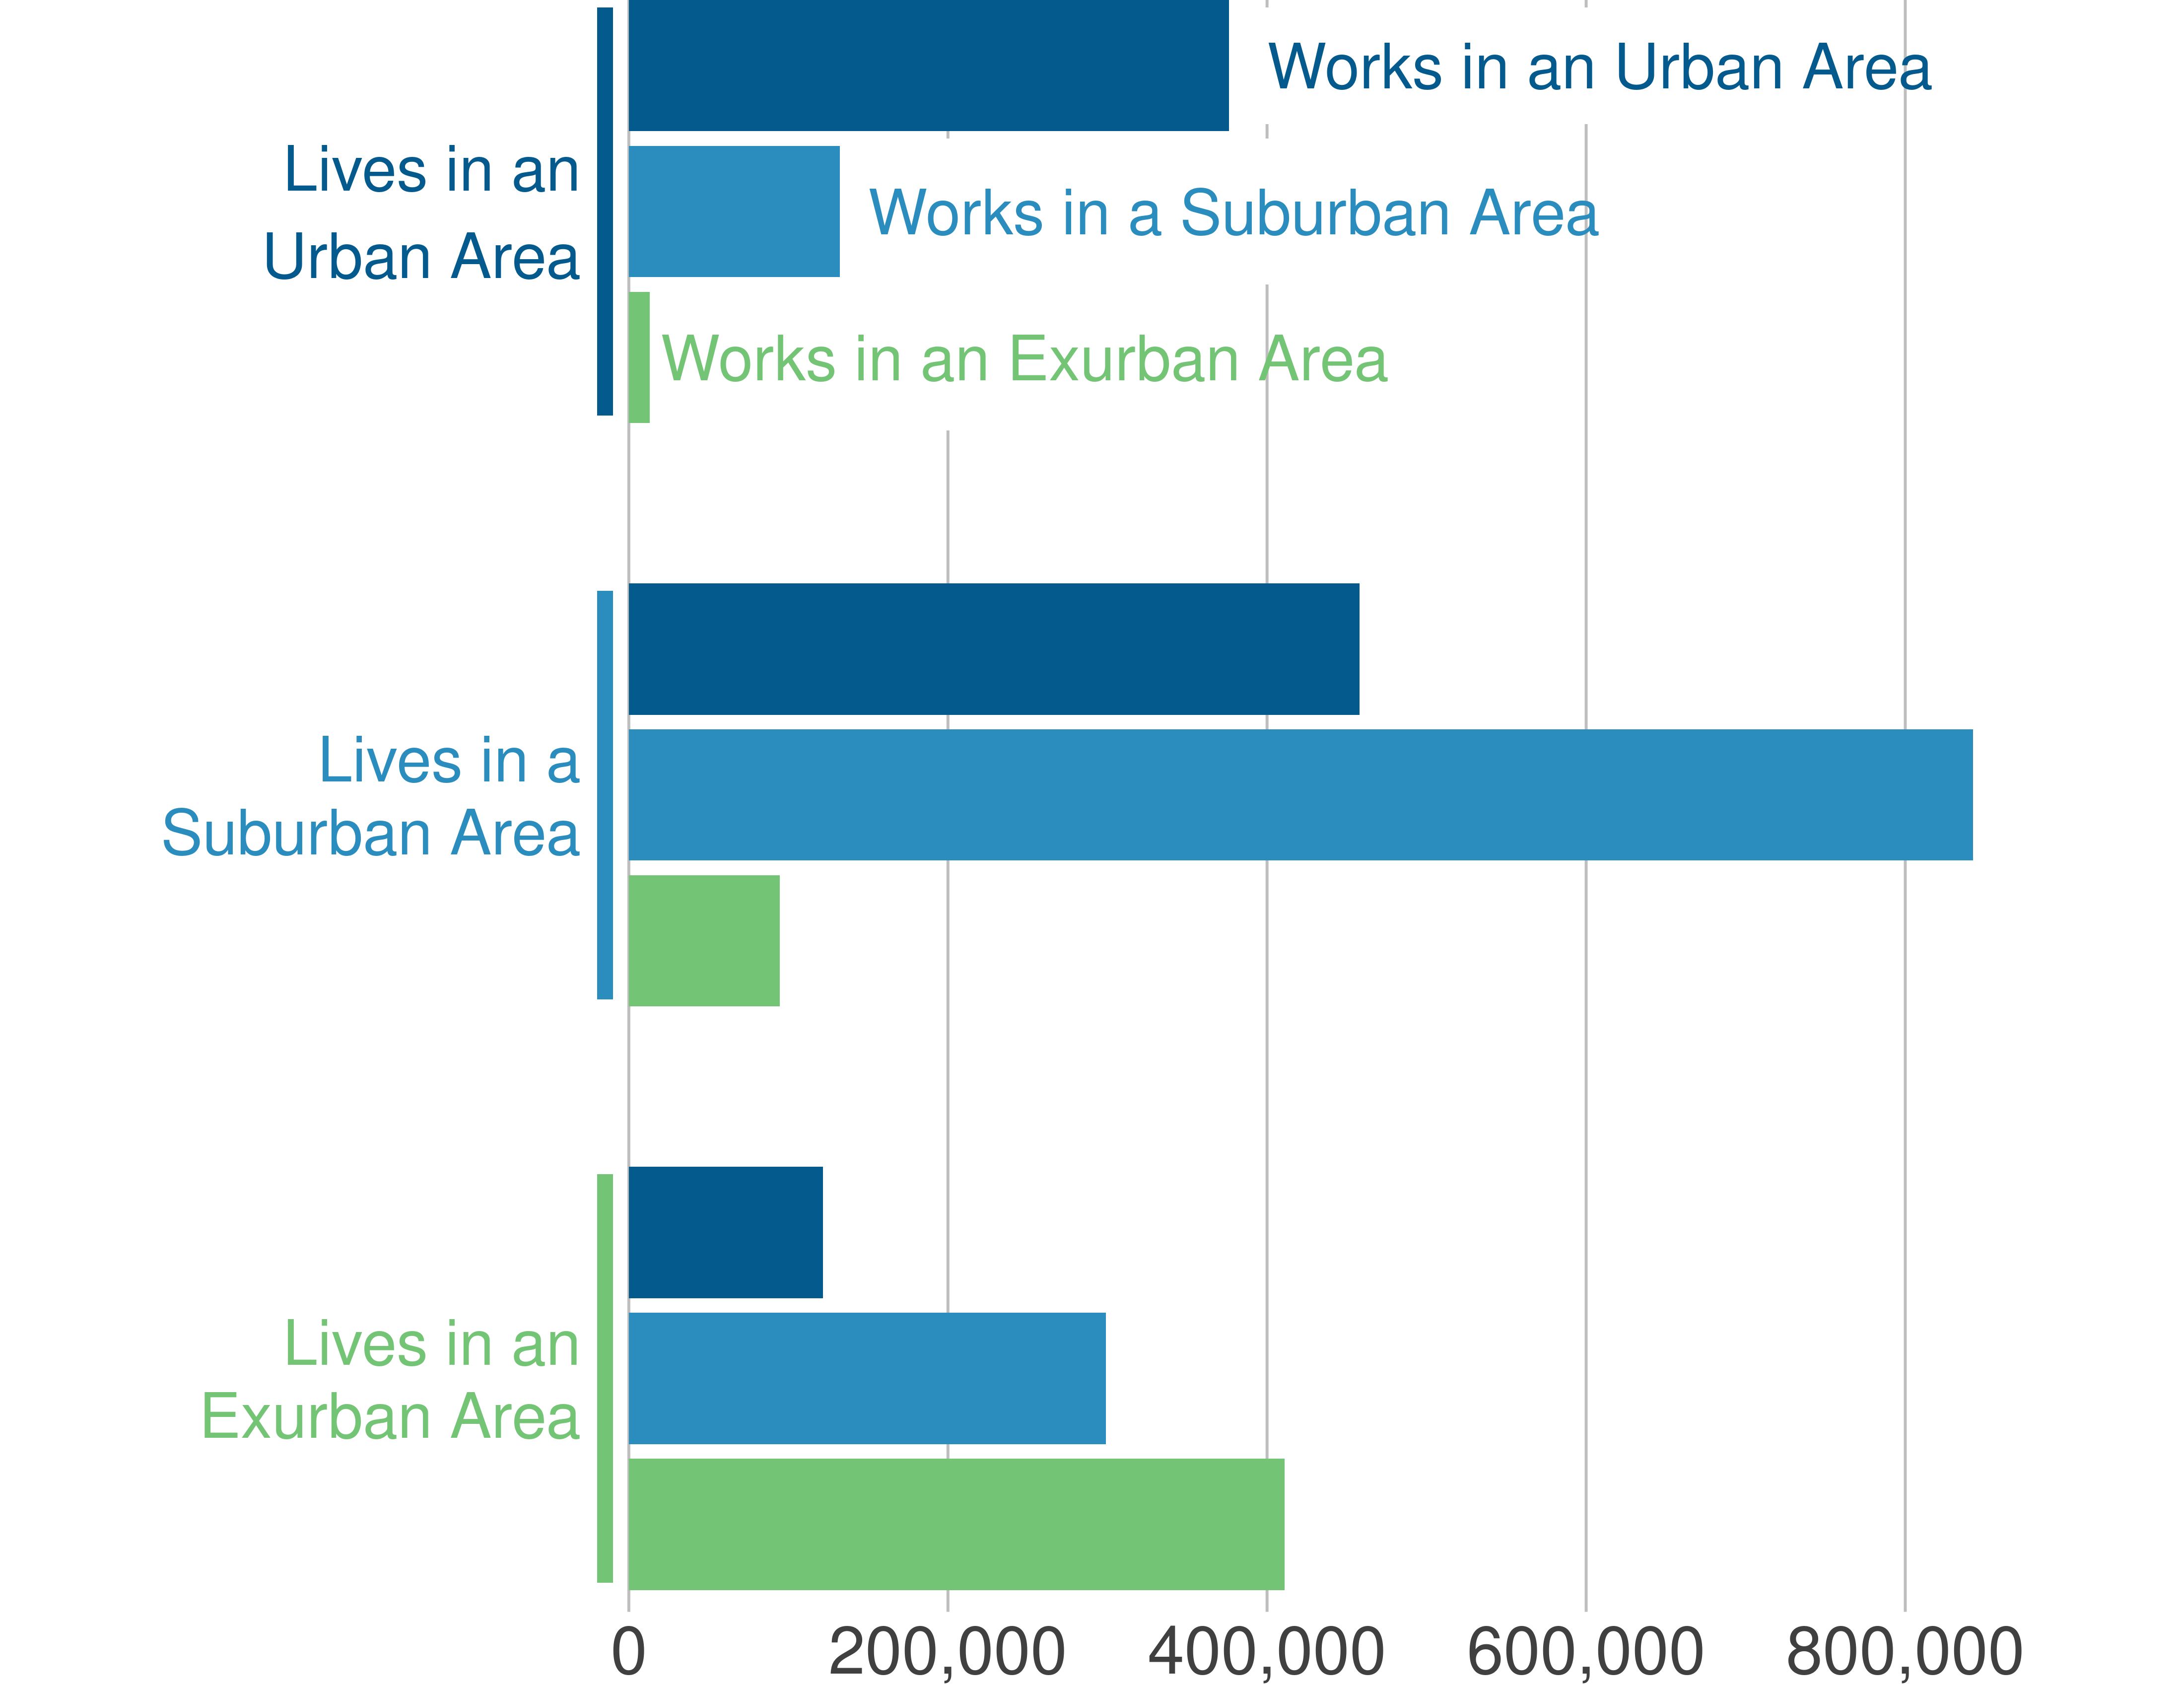
Source: LEHD Origin-Destination Employment Statistics, 2019.
As we see, COVID has impacted driving patterns substantially less than transit use. However, as we look ahead, higher gas prices may create a headwind for drivers, altering current trends.