Gentrification: The Aftermath of a Tax Foreclosure
Figure 5: Tax Lien Sales to For-Profit Investors Amplify Differences in Housing Prices across Neighborhoods
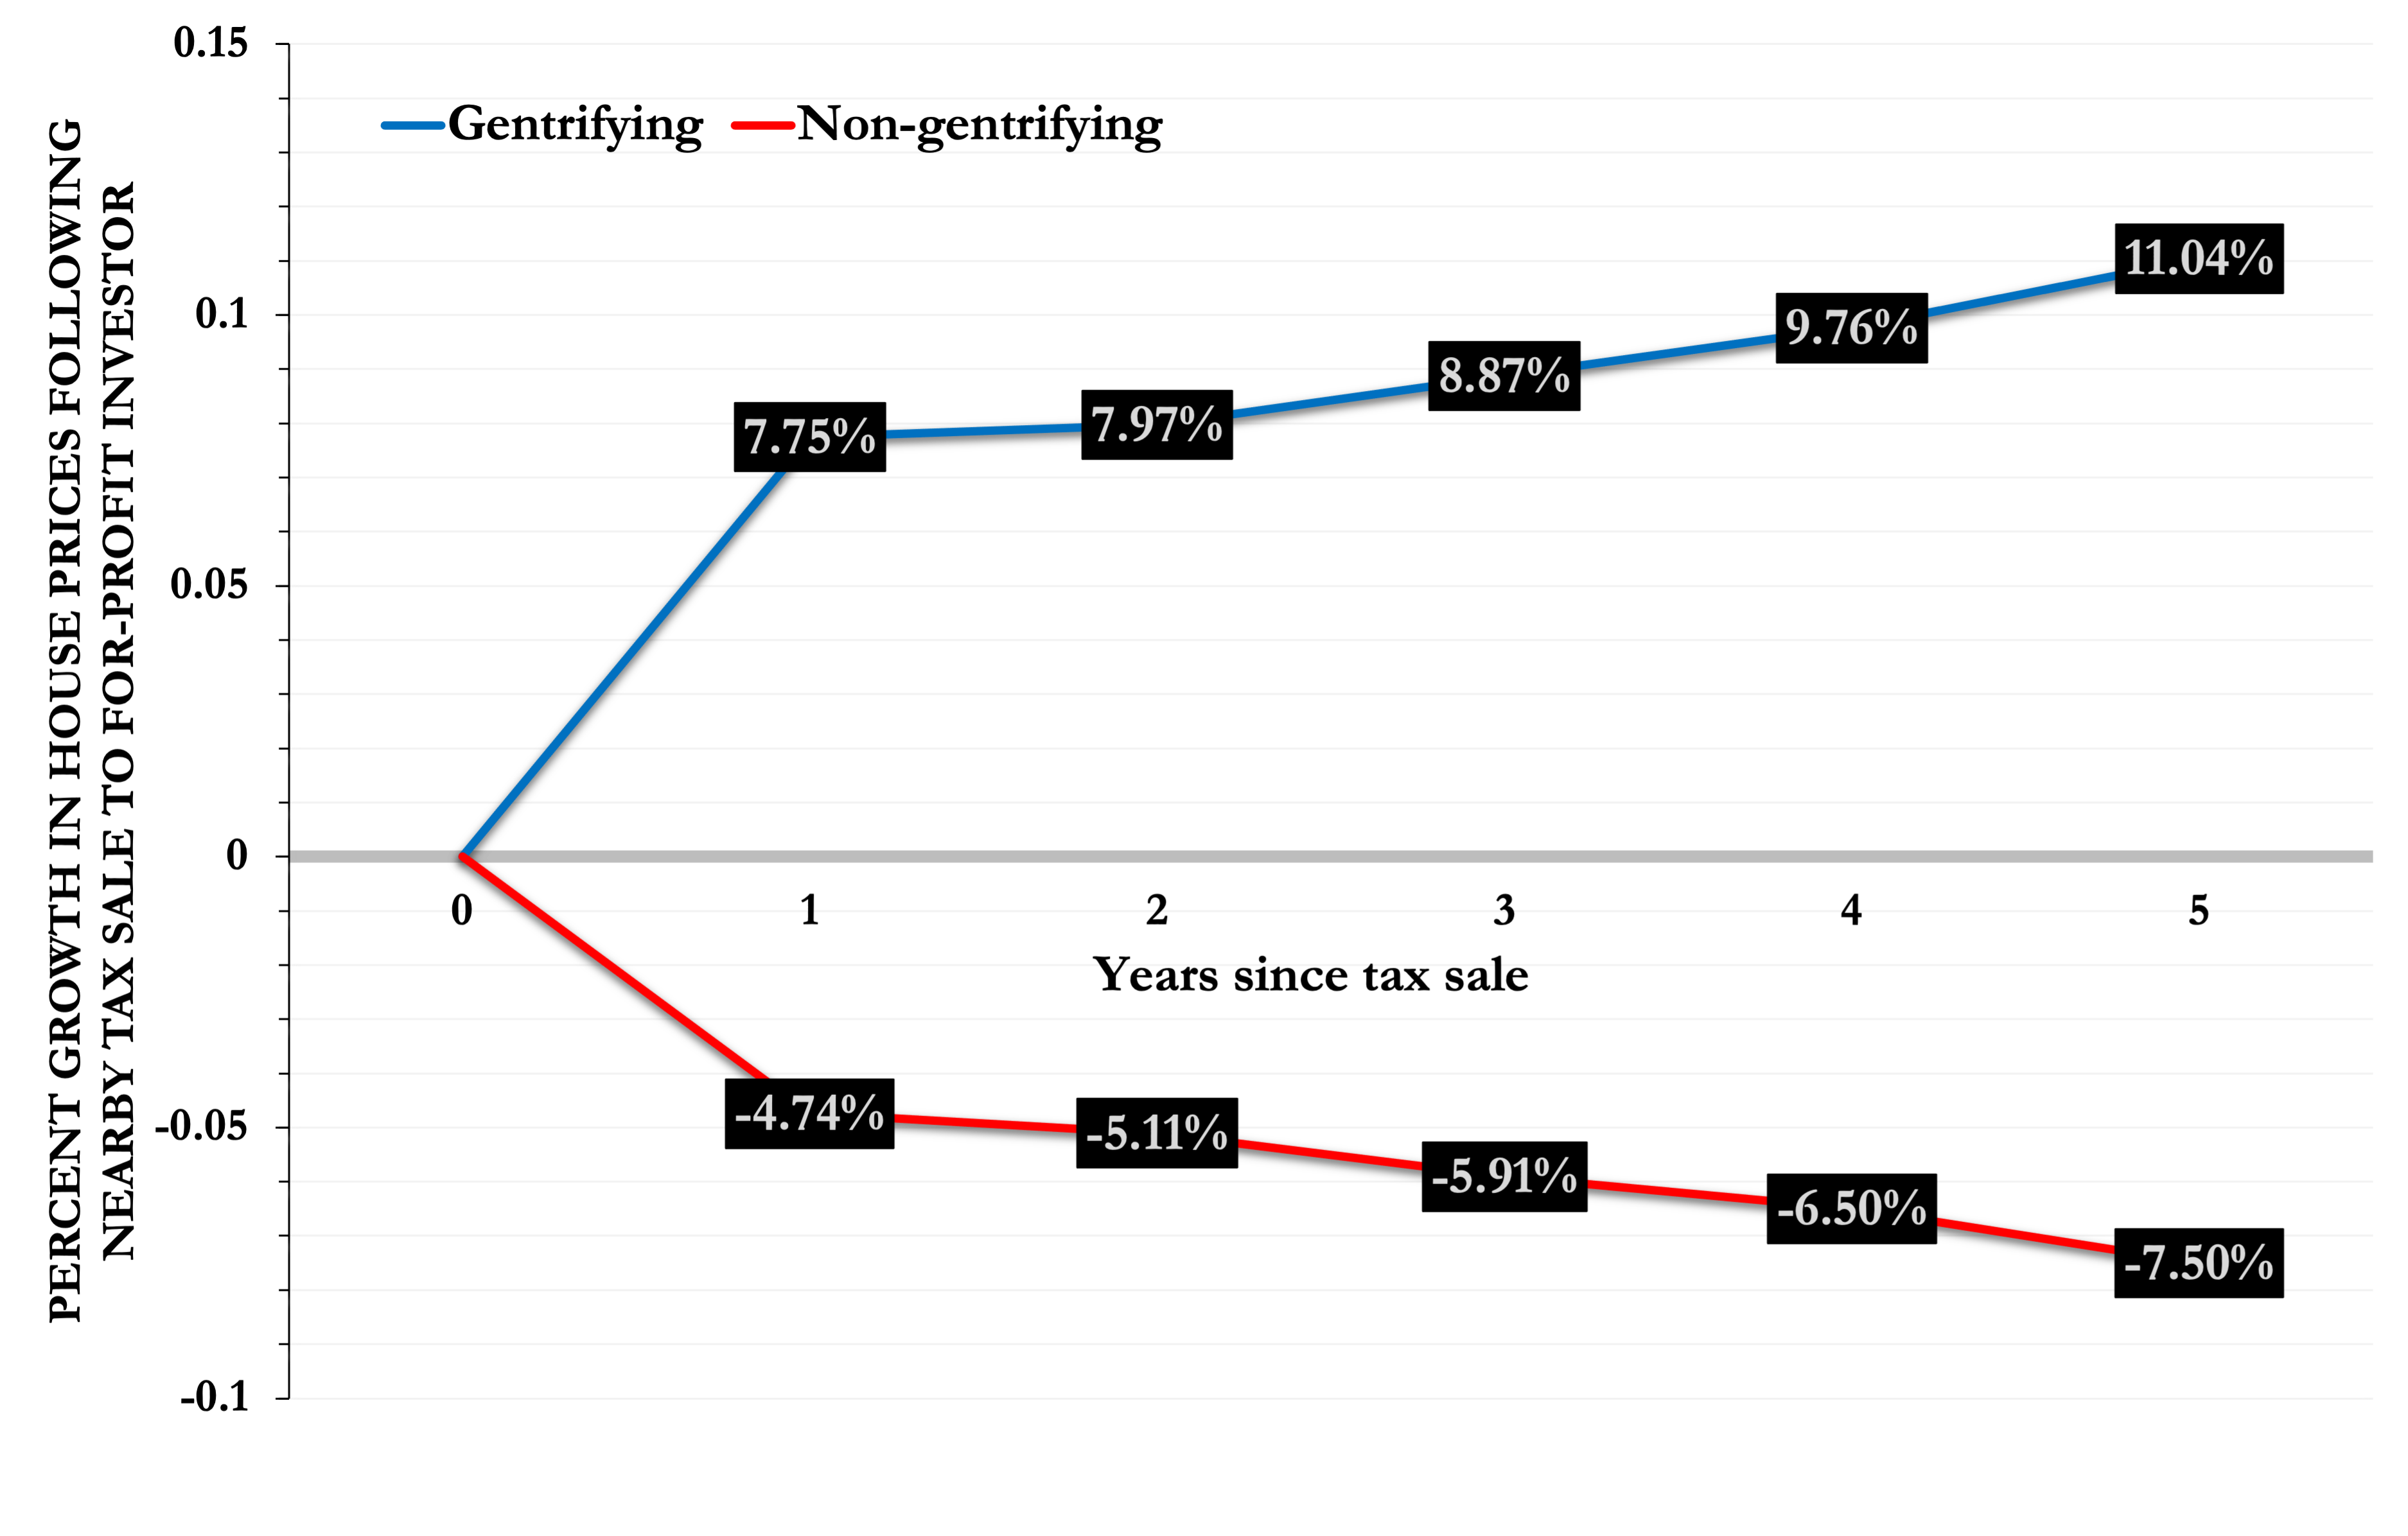
Source: The figure plots the percent change over time in sale prices for homes located within 0.1 miles of a property which was recently foreclosed on by a for-profit, non-individual investor. The points in blue show the effects of these types of tax sales in gentrifying D.C. Census tracts, while the points in red show the effects of tax sales in non-gentrifying D.C. Census tracts. For full details on the calculation of these estimates and the definition of gentrifying and non-gentrifying Census tracts, see: LaPoint, Cameron (2023): “Property Tax Sales, Private Capital, and Gentrification in the U.S.,” SSRN Working Paper, No. 4219360: [link].
New research by Cameron LaPoint examines how tax lien sales affect neighborhood demographics and the prices of nearby homes. Consider the case of a tax lien sale in a gentrifying neighborhood, such as Columbia Heights. In this case, the investor will often be an institution, such as an LLC with a non-descript name like “EMBASSY TAX SERVICES, LLC,” as in the case of the Marine with a property lien sold in 2007. Figure 5 shows that houses located near a property undergoing foreclosure and transfer to a for-profit investor experience, on average, a 9 percent price increase within the first three years after the foreclosure. In contrast, in non-gentrifying neighborhoods — which tend to have the highest concentration of taxpayers below the poverty line — tax lien sales result in a 6 percent average price decline for nearby properties within the first three years after foreclosure.
These higher home prices in gentrifying neighborhoods after the tax lien sale, in turn, reinforce racial demographic changes in that neighborhood. There are two ways in which this can happen. First, Black and Hispanic homeowners who have their property sold at a tax auction are over-represented by 40 percent relative to the overall share of homeowners in the population who are Black or Hispanic.1 In other words, severe cases of property tax delinquency can result in displacement of underrepresented minority homeowners. The disparate impact of property tax delinquencies on non-white homeowners has been exacerbated by the trend towards higher tax rates imposed on properties in predominantly Black neighborhoods. A recent nationwide study examining property tax bills found that, for the same set of local public goods and services, the median minority homeowner pays over 300 dollars more annually than the median white homeowner.2
Figure 6: Prospective Underrepresented Minority Homebuyers Less Likely to Buy in Neighborhoods Where Tax Lien Sales Occur
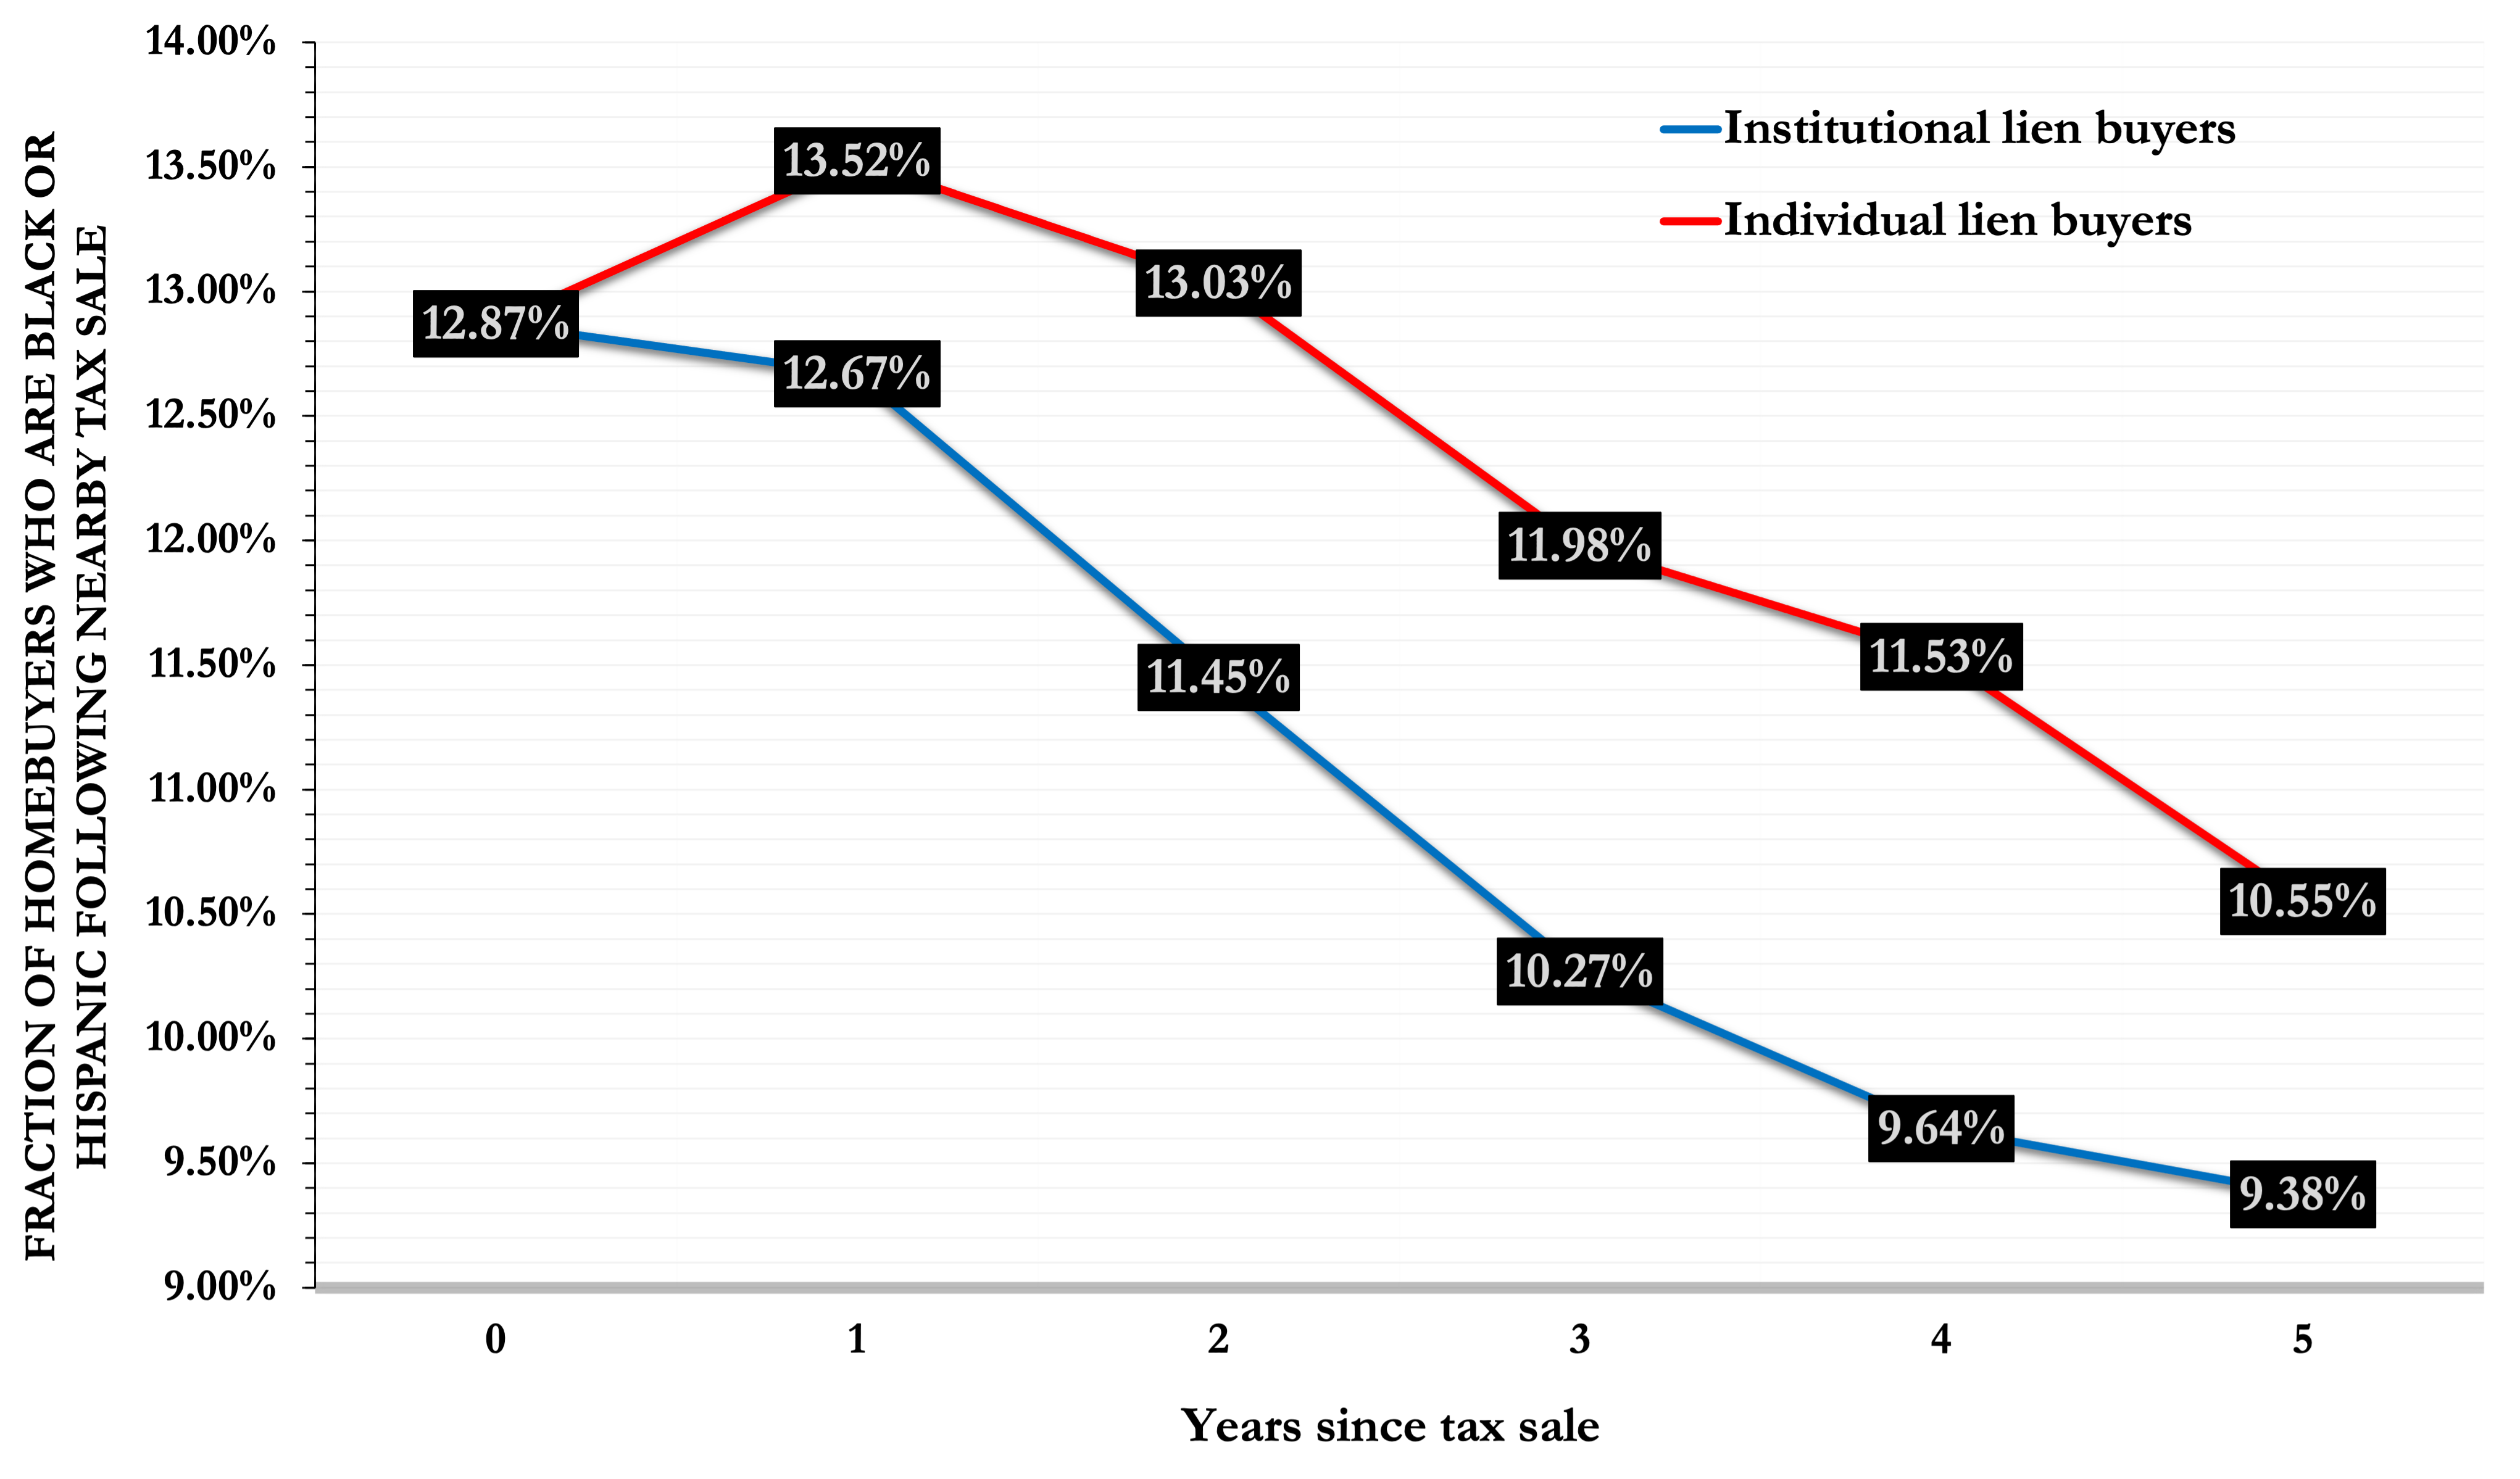
Source: The figure plots the fraction of Black or Hispanic homebuyers located within 0.1 miles of a property which was recently foreclosed on by a for-profit, non-individual investor. The starting point of 12.87 percent is the average Black or Hispanic homebuyer probability in the year a tax sale occurs in the neighborhood. The points in blue show the effects of tax sales to institutional investors, while the points in red show the effects of tax sales to individual investors in D.C. For full details on the calculation of these estimates and the definition of institutional and individual investors, see: LaPoint, Cameron (2023): “Property Tax Sales, Private Capital, and Gentrification in the U.S.,” SSRN Working Paper, No. 4219360: [link].
Second, as shown in Figure 6, within five years after the typical tax lien sale to an institutional investor, the chance that an incoming homebuyer in the neighborhood is Black or Hispanic drops from 13 percent to 9 percent. This measured effect is still present but weaker in magnitude when the tax lien is instead sold to an individual investor. The probability that an incoming homebuyer in the neighborhood is Black or Hispanic drops from 13 percent to 11 percent.
What is driving this trend of a decline in Black and Hispanic homebuyers in neighborhoods where tax liens are common? Is it the higher prices that accompany gentrification and make home purchases less affordable, as Figure 5 suggests? And, relatedly, why would surrounding properties increase in value after tax foreclosures in the area?
Figure 7 helps answer these questions by showing how the trajectory of home values can vary across neighborhoods depending on the total volume of lien sales. Tax sales are highly geographically clustered. For example, the average neighborhood of a 0.1-mile radius size experiences only two tax lien sales over the course of the typical year. But the top one percent of neighborhoods by tax sale volume experience anywhere from 64 to 94 tax lien sales. Figure 7 shows that for the average neighborhood, home values decline by 3 percent following a nearby tax sale. But for neighborhoods where tax delinquency is quite common, home values instead increase by anywhere from 2 percent to 5 percent.
Figure 7: Neighborhood Redevelopment to Upscale Residential Properties Occurs Through Purchases of Tax Liens in Bulk
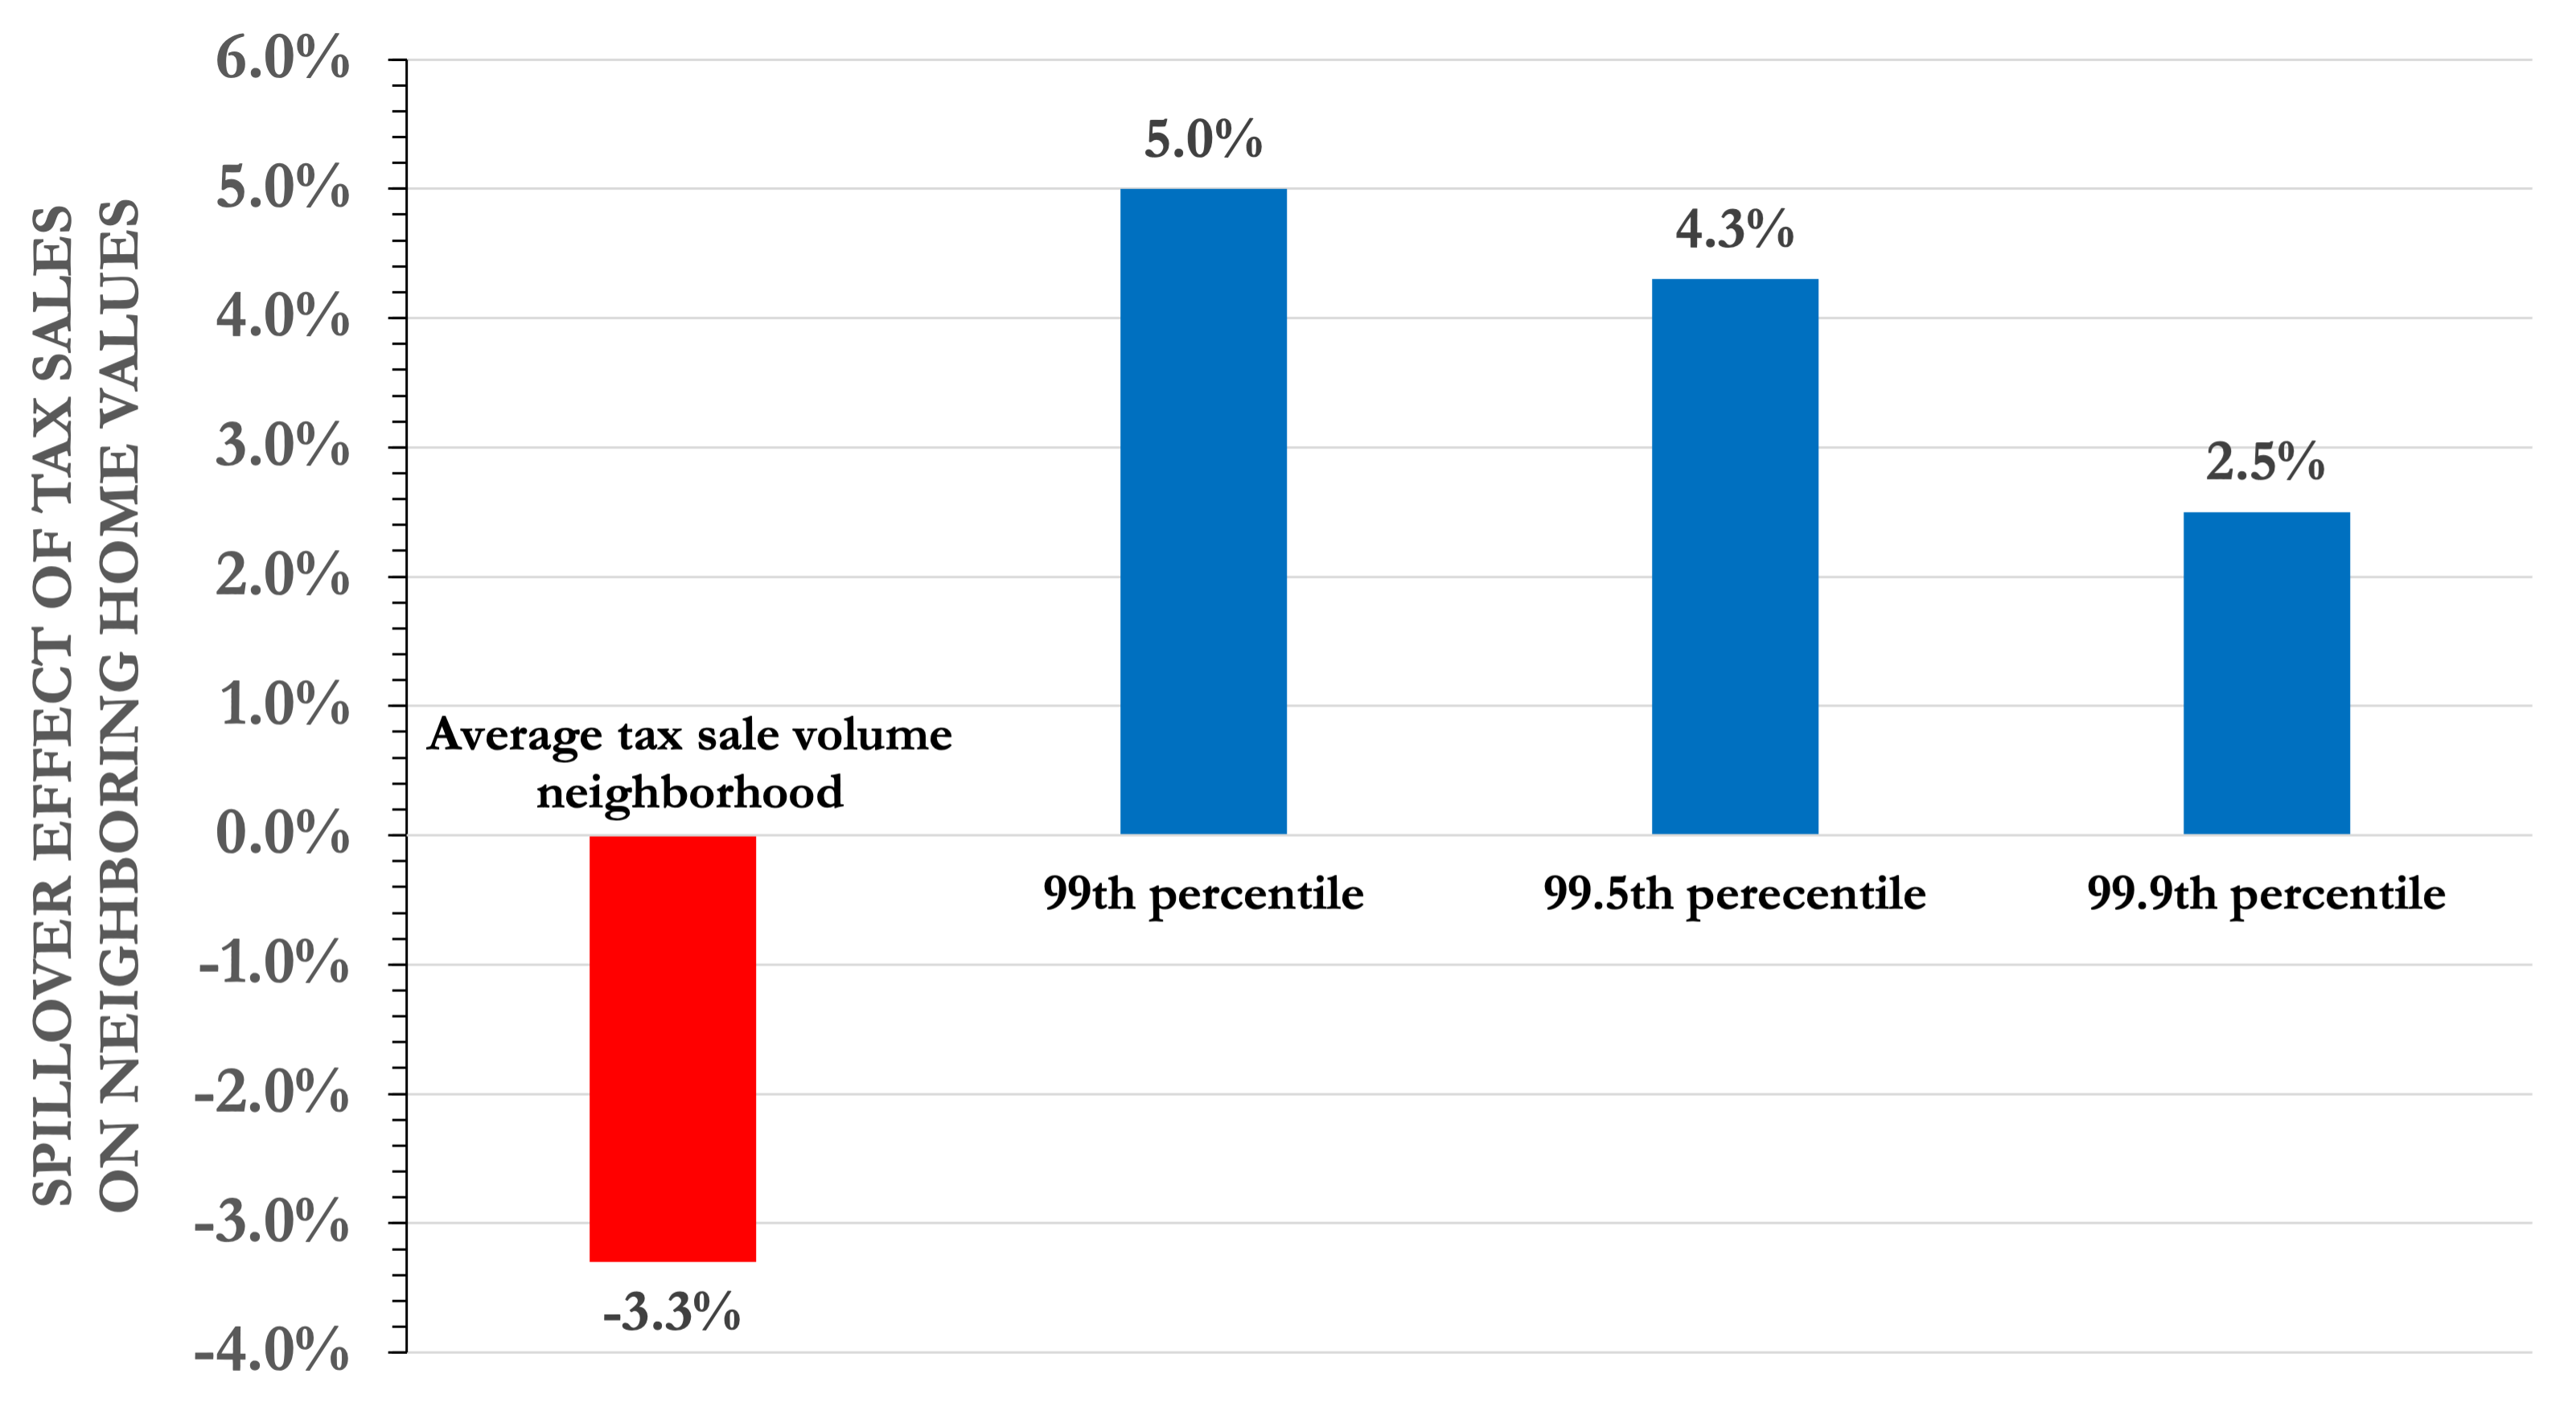
Source: The figure shows the effect of an additional tax lien sale on home values of properties located within a 0.1-mile radius for different neighborhood types. The red bar displays the effect on nearby home values within the average neighborhood. The blue bars display the effect on home values within neighborhoods where tax delinquency is very common. A neighborhood at the 99th percentile experiences 47 tax sales in a typical year, while neighborhoods at the 99.5th and 99.9th percentiles experience 54 and 64 tax sales, respectively. For full details see: LaPoint, Cameron (2023): “Property Tax Sales, Private Capital, and Gentrification in the U.S.,” SSRN Working Paper, No. 4219360: [link].
What explains this divergence in house prices across neighborhoods? The most active investors at tax lien auctions tend to buy in bulk. In D.C., the top 50 buyers of tax liens accounted for over half of all tax liens sold between 2005 and 2019; all but four of the top 50 buyers were institutions. Similarly, in Baltimore County, just nine institutional bidders accounted for over half of the 13,050 liens sold between 2015 and 2022.3 Buying large batches of liens located near each other is a common strategy of tax lien investors who are looking to redevelop tax-delinquent homes into upscale residential and mixed-use commercial properties. This kind of redevelopment caters to the demands of new, higher-income residents at the expense of current residents, who tend to be predominantly lower-income, non-white, and elderly individuals.
LaPoint, Cameron (2023): “Property Tax Sales, Private Capital, and Gentrification in the U.S.,” SSRN Working Paper, No. 4219360: https://papers.ssrn.com/sol3/papers.cfm?abstract_id=4219360. ↩︎
Avenancio-León, Carlos & Troup Howard (2022): “The Assessment Gap: Racial Inequalities in Property Taxation,” Quarterly Journal of Economics, 137(3): 1383-1434.↩︎
Tabulations based on LaPoint’s analysis of tax lien sale records from D.C. Office of Tax and Revenue and Baltimore County Government [link].↩︎